Nvidia GeForce GTX 670 2 GB Graphics Card Review

The most important question, which is of great interest to many users, is the following: will the overclocked GeForce GTX 670 be able to catch up with a more expensive GeForce GTX 680? Our today’s review will answer this and many other questions about this new product you might have.
Nvidia has been steadily extending its graphics card series based on 28-nanometer GK104 Kepler GPUs. The late-March release of the highly successful GeForce GTX 680 was followed by the early-May debut of the dual-processor flagship GeForce GTX 690 and, later on, by the GeForce GTX 670 which doesn’t yet seem to be mainstream to us, its recommended price being as high as $399. We do hope it will eventually become a mainstream product after a price cut. Right now, the new GeForce GTX 670 competes with the AMD Radeon HD 7950 which has the same recommended price. The competition is going to be exciting, especially as the GTX 670 seems to be even more attractive than the GTX 680…
Technical Specifications and Recommended Pricing
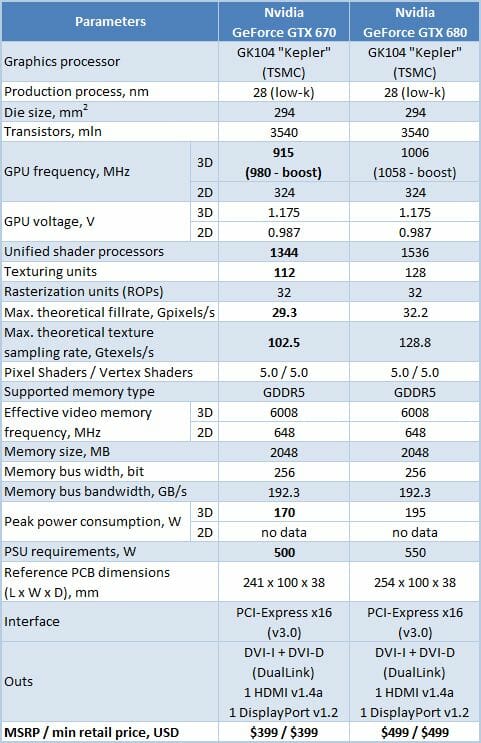
Technical specifications of the new Nvidia GeForce GTX 670 are given in the table below side by side with those of Nvidia GeForce GTX 680 (the differences are in bold font):
Design and Functionality
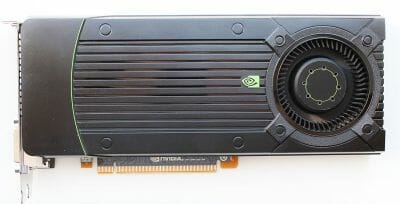
We’ve got a reference sample of the new card to test and it is hardly impressive. The face side of the PCB is covered by the black plastic casing of the cooler.
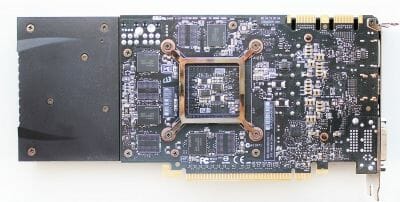
But when we take a look at the reverse side, we see an original solution: the short PCB is extended by means of a piece of plastic the cooler’s fan is fastened on. The GeForce GTX 670 is 241 millimeters long, which is 13 millimeters shorter than the GeForce GTX 680, but its PCB is a mere 170 millimeters long.
Like the reference GTX 680, the GeForce GTX 670 is equipped with two dual-link DVI outputs, one HDMI 1.4a connector and one DisplayPort version 1.2:
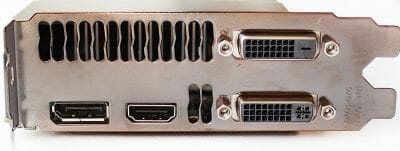
Thus, the GeForce GTX 670 can work with multi-monitor configurations (up to 4 displays simultaneously).
There are two 6-pin power connectors at the very edge of the short PCB.
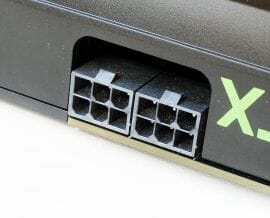
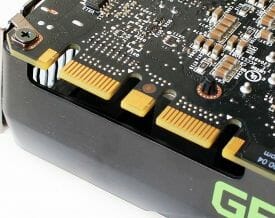
The card’s peak power consumption is 170 watts in 3D mode as opposed to the GeForce GTX 680’s 195 watts. Using the MIO connectors located in their usual place, you can combine up to four GeForce GTX 670s into a SLI configuration.
The PCB seems to be kind of unfinished due to its small size. It looks as if it were sawn off along the memory chips.
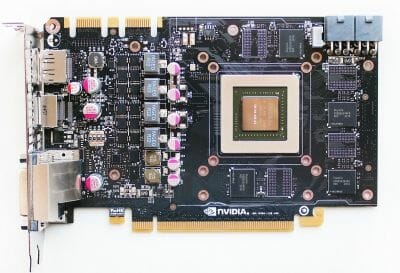
So, the power circuit components are located in between the GPU and the video interfaces, just like on AMD’s Radeon HD 7870 and HD 7850 cards.
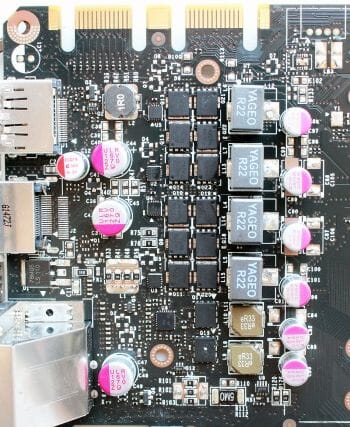
Managed by an ON Semiconductor NCP5392P controller, there are four power phases for the GPU and two for the graphics memory. That’s a cheap and simple solution but how reliable is it?
The 28nm GPU of our card was manufactured in Taiwan on the 3rd week of 2012. It is revision A2 (the only revision spotted in retail so far).
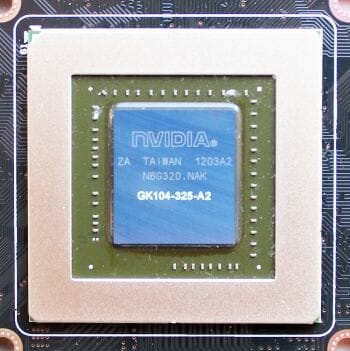
As opposed to the full-featured GK104 Kepler, the GeForce GTX 670 is equipped with a simplified version of the GPU that has one out of the eight available SMX units turned off on the hardware level. The resulting GPU has 1344 unified shader processors and 112 texture-mapping units instead of the original version’s 1536 and 128. The number of raster operators has remained the same at 32. The base GPU clock rate in 3D mode is lowered from 1008 to 915 MHz at 1.175 volts while the GPU Boost technology can increase it by 65 MHz up to 980 MHz. The clock rate is dropped to 324 MHz at 0.987 volts in 2D mode.
The GeForce GTX 670 comes with 2 gigabytes of FCBGA-packaged GDDR5 memory in Hynix Semiconductor chips labeled as H5GQ2H24AFR R0C. They have a rated clock rate of 6000 MHz.
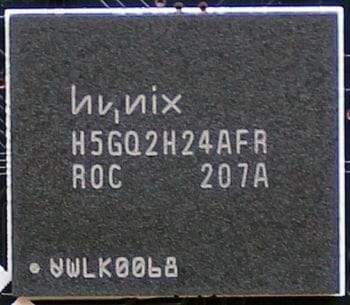
The 3D clock rate of the chips is 6008 MHz. Coupled with a 256-bit bus, this translates into a peak bandwidth of 192.3 GB/s, just like on the GeForce GTX 680. The memory clock rate is dropped to 648 MHz in 2D mode. The memory chips are located on both sides of the PCB and there are places for more chips there. So, we won’t be surprised to see 4GB versions of GeForce GTX 670 in the future.
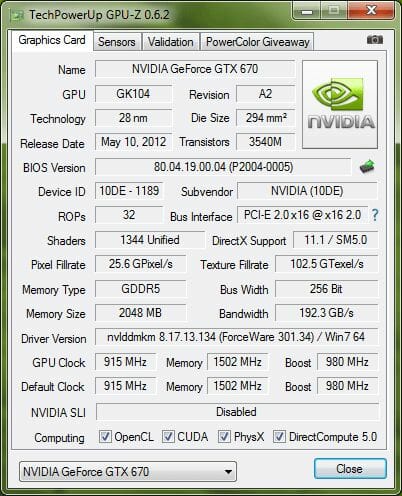
Here is a summary of the reference Nvidia GeForce GTX 670 specs:
Cooling System: Efficiency and Noise
The plastic casing of the cooling system is fastened along its edge. It is quite easy to remove.
It hides an aluminum heatsink on the power components, a GPU heatsink and a fan secured on the plastic extension of the PCB.
The GPU heatsink consists of a copper base with aluminum fins soldered to it.There is no vapor chamber and no heat pipes here.The reference GeForce GTX 670 cooler also includes a simple 70mm PWM-regulated fan and a tall heatsink for power system components.
The unsophisticated cooler, short PCB and rather simple power circuit do not quite match the product’s price tag of $400, but that’s what Nvidia offers for that money.
We checked out the card’s temperature while running Aliens vs. Predator (2010) in five cycles at the highest settings (2560×1600, with 16x anisotropic filtering and 4x antialiasing).
We used MSI Afterburner 2.2.0 and GPU-Z 0.6.2 as monitoring tools. This test was carried out with a closed system case at an ambient temperature of 25°C. We didn’t change the card’s default thermal interface.
Let’s see what temperature the card has when its fan is regulated automatically and at the maximum speed of the fan.The GPU is as hot as 81°C in the automatic regulation mode, the fan reaching 2190 RPM. The GeForce GTX 680 had the same GPU temperature but its fan speed was lower by 270 RPM. At the maximum speed of 3750 RPM the GPU is no hotter than 65°C. This is 3°C higher compared to the reference GeForce GTX 680 but the latter’s fan worked at 4200 RPM.
We measured the level of noise using an electronic noise-level meter CENTER-321 in a closed and quiet room about 20 sq. meters large. The noise-level meter was set on a tripod at a distance of 15 centimeters from the graphics card which was installed on an open testbed. The mainboard with the graphics card was placed at an edge of a desk on a foam-rubber tray.
The bottom limit of our noise-level meter is 29.8 dBA whereas the subjectively comfortable (not low, but comfortable) level of noise when measured from that distance is about 36 dBA. The speed of the graphics card’s fan was being adjusted by means of a controller that changed the supply voltage in steps of 0.5 V.
We’ve included the results of reference Nvidia GeForce GTX 680 and AMD Radeon HD 7950 cards into the next diagram for the comparison’s sake (the vertical dotted lines indicate the top speed of the fans in automatic regulation mode).
The reference GeForce GTX 670 is no quieter than the GeForce GTX 680. Moreover, the cooling system of our sample changes its fan speed inconsistently as is indicated by the wavy shape of its noise graph. The cheap plastic of the cooler casing and of the PCB extension with fan resonates, causing even more discomfort. Unfortunately, the GeForce GTX 670 is unsatisfactory in this test.
Overclocking Potential
It didn’t take us long to check out the overclocking capabilities of our GeForce GTX 670 because we had already learned the typical frequency range of the GK104 chip from our GeForce GTX 680 tests. The junior model can hardly have a higher-quality GPU. So, we overclocked it to a GPU clock rate of 1070 MHz (1253 MHz in boost mode according to our monitoring tools) and to a memory clock rate of 7028 MHz.
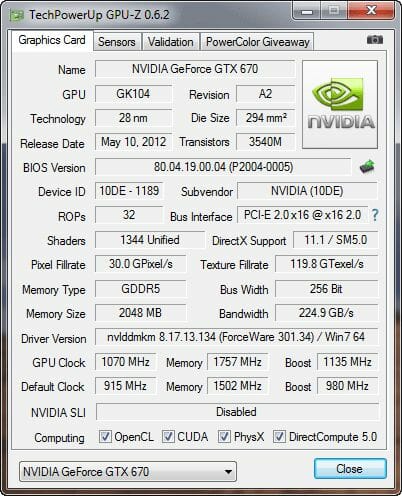
The memory chips reached a rather high frequency whereas the GPU didn’t impress us with its overclocking potential. Hopefully, off-the-shelf versions of this card are going to be better in terms of overclocking.
At the higher GPU and memory clock rates, the card’s GPU was 83°C hot at a fan speed of 2340 RPM.We wish we could also measure the temperature of the power components on such a densely populated PCB, but the reference GeForce GTX 670 lacks appropriate sensors.
Testbed Configuration and Testing Methodology
Nvidia GeForce GTX 670 and its competitors were tested in a system with the following configuration:
- Mainboard: Intel Siler DX79SI (Intel X79 Express, LGA 2011, BIOS 0460 from 04/24/2012);
- CPU: Intel Core i7-3960X Extreme Edition, 3.3 GHz, 1.2 V, 6 x 256 KB L2, 15 MB L3 (Sandy Bridge-E, C1, 32 nm);
- CPU cooler: Phanteks PH-TC14PE (2 x 135 mm fans at 900 RPM);
- Thermal interface: ARCTIC MX-4;
- System memory: DDR3 4 x 4GB Mushkin Redline (Spec: 2133 MHz / 9-11-10-28 / 1.65 V);
- Graphics cards:
- Nvidia GeForce GTX 680 2 GB, 256 bit, GDDR5, 1006/6008 MHz;
- Nvidia GeForce GTX 670 2 GB, 256 bit GDDR5, 915/6008 MHz and 1070/7028 MHz;
- Sapphire Radeon HD 7950 OC Dual-X 3 GB, 384 bit, GDDR5, 800/5000 MHz;
- Asus GeForce GTX 560 Ti 440 Cores DirectCU II, 320 bit, GDDR5, 732/1464/3800 MHz;
- System drive: Crucial m4 256 GB SSD (SATA-III,CT256M4SSD2, BIOS v0009);
- Drive for programs and games: Western Digital VelociRaptor (300GB, SATA-II, 10000 RPM, 16MB cache, NCQ) inside Scythe Quiet Drive 3.5” HDD silencer and cooler;
- Backup drive: Samsung Ecogreen F4 HD204UI (SATA-II, 2 TB, 5400 RPM, 32 MB, NCQ);
- System case: Antec Twelve Hundred (front panel: three Noiseblocker NB-Multiframe S-Series MF12-S2 fans at 1020 RPM; back panel: two Noiseblocker NB-BlackSilentPRO PL-1 fans at 1020 RPM; top panel: standard 200 mm fan at 400 RPM);
- Control and monitoring panel: Zalman ZM-MFC3;
- Power supply: Xigmatek “No Rules Power” NRP-HC1501 1500 W (with a default 140 mm fan);
- Monitor: 30” Samsung 305T Plus.
In order to lower the dependence of the graphics cards performance on the overall platform speed, I overclocked our 32 nm six-core CPU with the multiplier set at 37x, BCLK frequency set at 125 MHz and “Load-Line Calibration” enabled to 4.625 GHz. The processor Vcore was increased to 1.46 V in the mainboard BIOS.
Hyper-Threading technology was enabled. 16 GB of system DDR3 memory worked at 2 GHz frequency with 9-10-10-28 timings and 1.65V voltage.
The test session started on May 14, 2012. All tests were performed in Microsoft Windows 7 Ultimate x64 SP1 with all critical updates as of that date and the following drivers:
- Intel Chipset Drivers 9.3.0.1020 WHQL from 01/26/2011 for the mainboard chipset;
- DirectX End-User Runtimes libraries from November 30, 2010;
- AMD Catalyst 12.3 driver from 03/28/2012 + Catalyst Application Profiles 12.3 (CAP1) from 03/29/2012 for AMD based graphics cards;
- Nvidia GeForce 301.34 driver for GeForce GTX 6xx graphics cards and GeForce 296.10 WHQL drivers for GeForce GTX 560 Ti 440 graphics card.
The graphics cards were tested in two resolutions: 1920×1080 and 2560×1600. The tests were performed in two image quality modes: “Quality+AF16x” – default texturing quality in the drivers with enabled 16x anisotropic filtering and “Quality+ AF16x+MSAA 4(8)x” with enabled 16x anisotropic filtering and full screen 4x or 8x antialiasing if the average framerate was high enough for comfortable gaming experience. We enabled anisotropic filtering and full-screen anti-aliasing from the game settings. If the corresponding options were missing, we changed these settings in the Control Panels of Catalyst and GeForce drivers. We also disabled Vsync there. There were no other changes in the driver settings.
The list of games and applications used in this test session includes two popular semi-synthetic benchmarking suites, one technical demo and 15 games of various genres:
- 3DMark Vantage (DirectX 10) – version 1.0.2.1, Performance and Extreme profiles (only basic tests);
- 3DMark 2011 (DirectX 11) – version 1.0.3.0, Performance and Extreme profiles;
- Unigine Heaven Demo (DirectX 11) – version 3.0, maximum graphics quality settings, tessellation at “extreme”, AF16x, 1280×1024 resolution with MSAA and 1920×1080 with MSAA 8x;
- S.T.A.L.K.E.R.: Call of Pripyat (DirectX 11) – version 1.6.02, Enhanced Dynamic DX11 Lighting profile with all parameters manually set at their maximums, we used our custom cop03 demo on the Backwater map;
- Left 4 Dead 2 (DirectX 9) – version 2.1.0.0, maximum graphics quality settings, proprietary d98 demo (two runs) on “Death Toll” map of the “Church” level;
- Metro 2033: The Last Refuge (DirectX 10/11) – version 1.2, maximum graphics quality settings, official benchmark, “High” image quality settings; tesselation, DOF and MSAA4x disabled; AAA aliasing enabled, two consecutive runs of the “Frontline” scene;
- Just Cause 2 (DirectX 11) – version 1.0.0.2, maximum quality settings, Background Blur and GPU Water Simulation disabled, two consecutive runs of the “Dark Tower” demo;
- Aliens vs. Predator (2010) (DirectX 11) – Texture Quality “Very High”, Shadow Quality “High”, SSAO On, two test runs in each resolution;
- Lost Planet 2 (DirectX 11) – version 1.0, maximum graphics quality settings, motion blur enabled, performance test “B” (average in all three scenes);
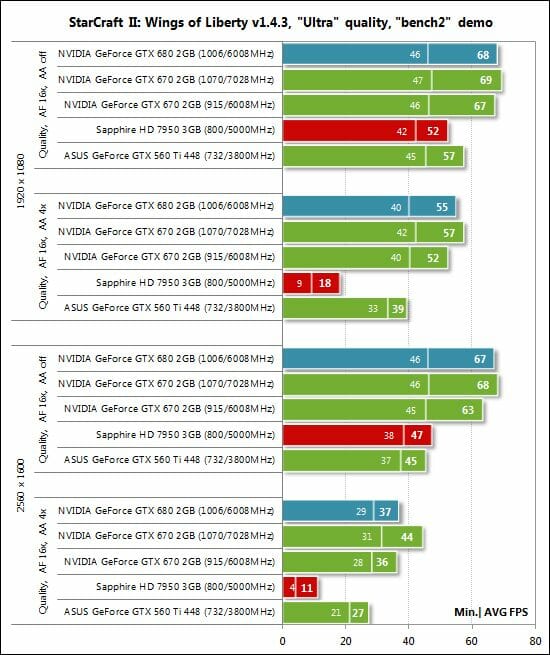
- StarCraft 2: Wings of Liberty (DirectX 9) – version 1.4.3, all image quality settings at “Extreme”, Physics at “Ultra”, reflections On, two 2-minute runs of our own “bench2” demo;
- Sid Meier’s Civilization V (DirectX 11) – version 1.0.1.348, maximum graphics quality settings, two runs of the “diplomatic” benchmark including five heaviest scenes;
- Tom Clancy’s H.A.W.X. 2 (DirectX 11) – version 1.04, maximum graphics quality settings, shadows On, tessellation Off (not available on Radeon), two runs of the test scene;
- Total War: Shogun 2 (DirectX 11) – version 2.0, built in benchmark (Sekigahara battle) at maximum graphics quality settings;
- Crysis 2 (DirectX 11) – version 1.9, we used Adrenaline Crysis 2 Benchmark Tool v.1.0.1.13. BETA with “Ultra High” graphics quality profile and activated HD textures, two runs of a demo recorded on “Times Square” level;
- DiRT 3 (DirectX 11) – version 1.2, built-in benchmark at maximum graphics quality settings on the “Aspen” track;
- Hard Reset Demo (DirectX 9) – benchmark built into the demo version with Ultra image quality settings, one test run;
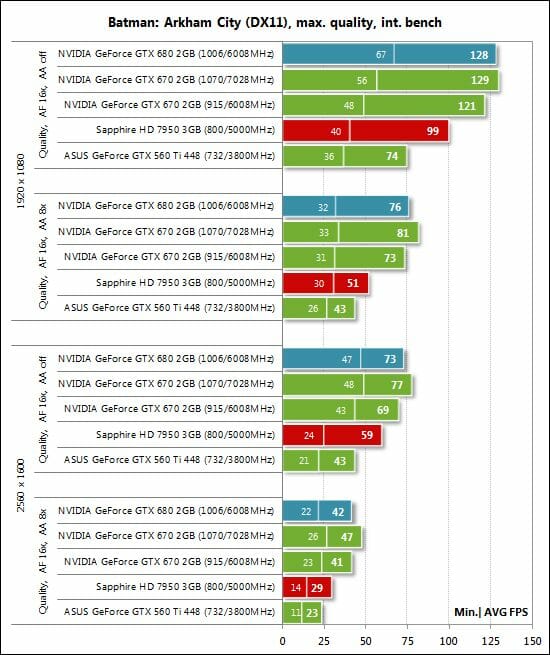
- Batman: Arkham City (DirectX 11) – version 1.2, maximum graphics quality settings, physics disabled, two sequential runs of the benchmark built into the game.
- Battlefield 3 (DirectX 11) – version 1.3, all image quality settings set to “Ultra”, two successive runs of a scripted scene from the beginning of the “Going Hunting” mission 110 seconds long.
If the game allowed recording the minimal fps readings, they were also added to the charts. We ran each game test or benchmark twice and took the best result for the diagrams, but only if the difference between them didn’t exceed 1%. If it did exceed 1%, we ran the tests at least one more time to achieve repeatability of results.
Performance
3DMark Vantage
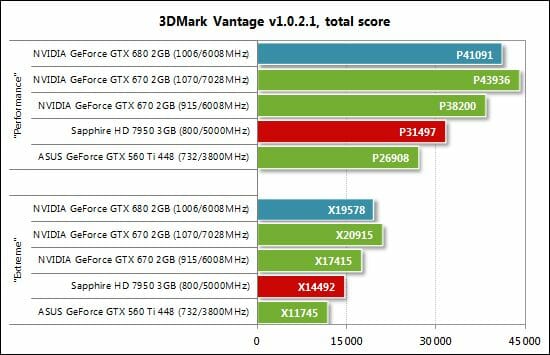
The new GeForce GTX 670 delivers excellent performance in our first semi-synthetic benchmark. It is a mere 8-12% behind the GeForce GTX 680 and can easily bridge this gap by being overclocked to 1070/7028 MHz. The AMD Radeon HD 7950 is outperformed by as much as 20%!
3DMark 2011
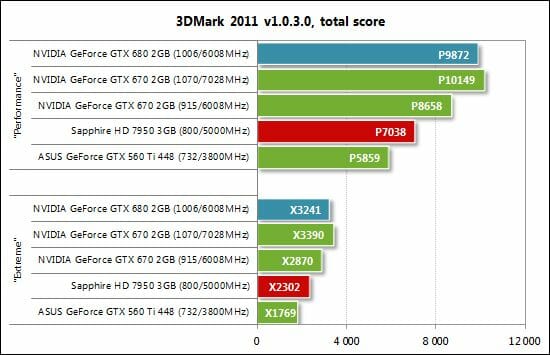
The same goes for the newer version of the benchmark except that the gaps between the graphics cards are larger. For example, the GeForce GTX 670 is now 23-25% ahead of the Radeon HD 7950 and as much as 50% faster than the GeForce GTX 560 Ti 448.
Unigine Heaven Demo
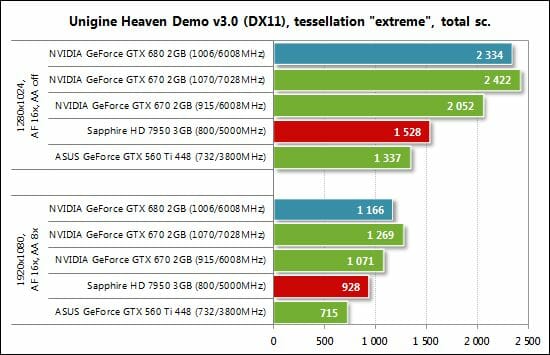
As you can see, the GeForce GTX 670 performs confidently in this benchmark as well.
S.T.A.L.K.E.R.: Call of Pripyat
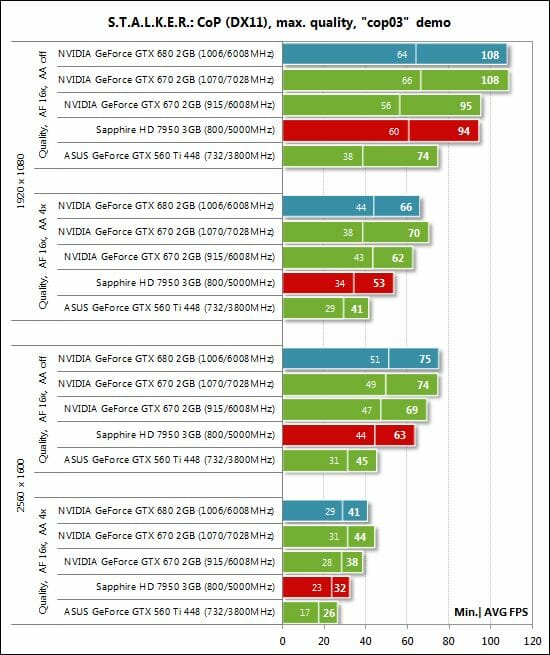
The GeForce GTX 670 is still ahead of the Radeon HD 7950, although the gap is smaller than in the previous three tests. When overclocked, the new card can challenge and even overtake the GeForce GTX 680.
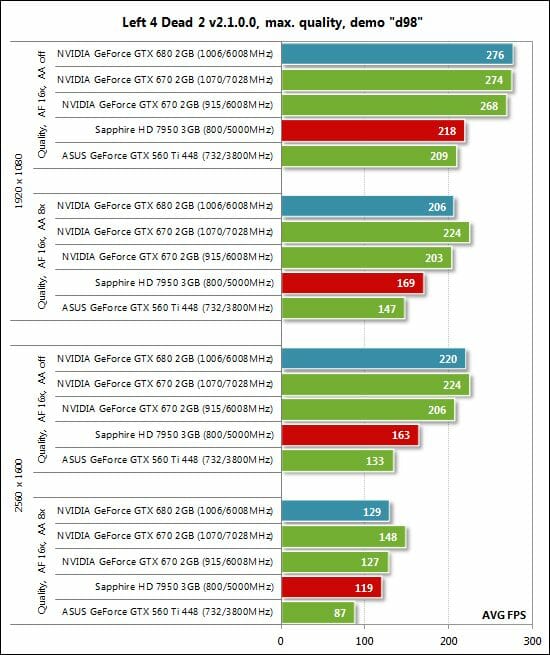
Left 4 Dead 2
The same standings can be observed in Left 4 Dead 2:
Metro 2033: The Last Refuge
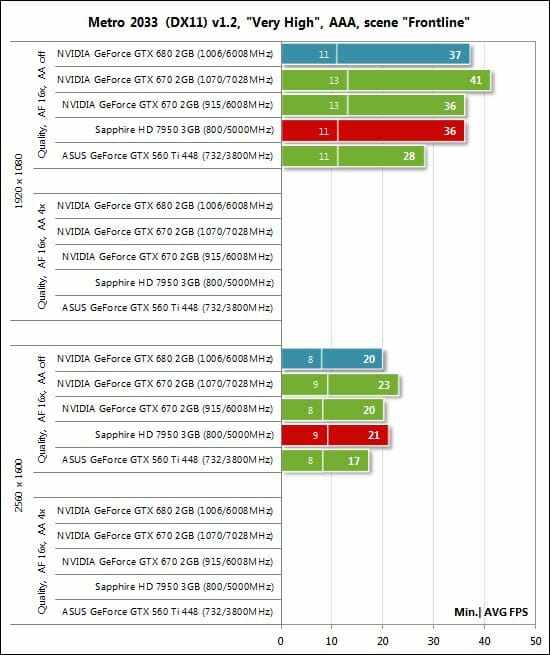
Metro 2033: The Last Refuge is one of the three games on our list where the Radeon HD 7950 can successfully oppose the new GeForce GTX 670. Otherwise, we have the same standings as in the previous tests.
Just Cause 2
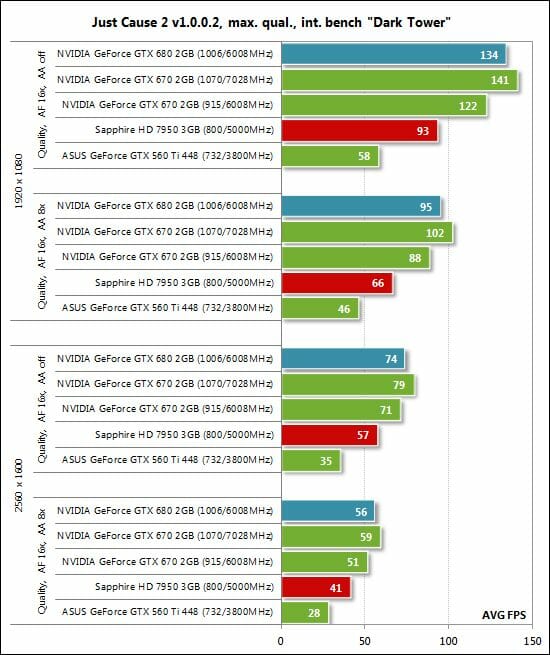
The GeForce GTX 670 is 25-33% faster than the Radeon HD 7950 in Just Cause 2. It is also 4-10% slower than the GeForce GTX 680 but 5-7% ahead of the latter when overclocked. That’s not bad for a graphics card that costs much less than the GeForce GTX 680!
Aliens vs. Predator (2010)
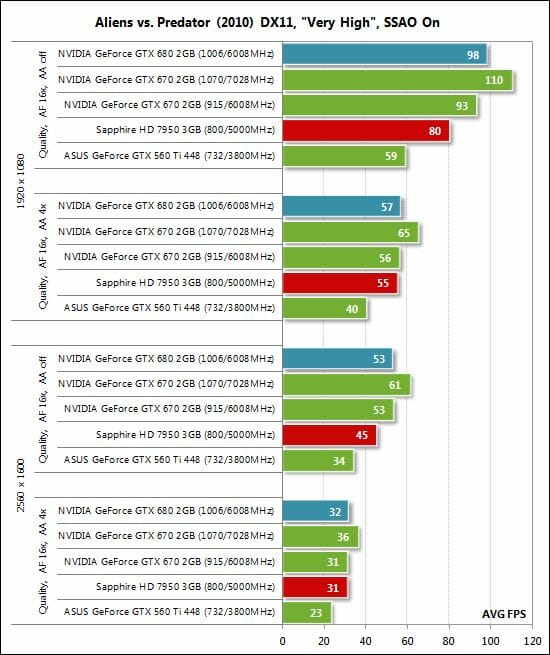
The GeForce GTX 670 is equal to the Radeon HD 7950 when antialiasing is enabled. Without antialiasing the GTX 670 is 16-18% faster than its opponent. The new card is slower than the GeForce GTX 680 at its default clock rates but overtakes the latter when overclocked.
Lost Planet 2
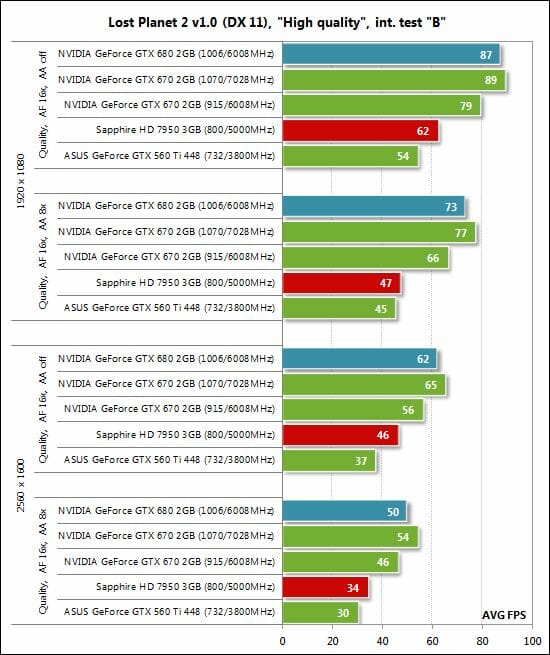
The GeForce GTX 670 scores another win over the Radeon HD 7950 in Lost Planet 2. This could be expected since the game’s engine is optimized for Nvidia-based products.
StarCraft II: Wings of Liberty
We’ve got no surprises in this game, either:
Sid Meier’s Civilization V
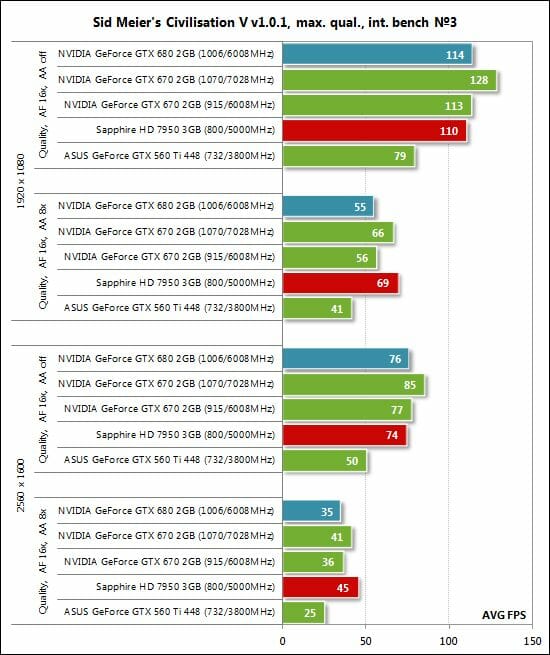
The Radeon HD 7950 is overall better in Sid Meier’s Civilization V even though the GeForce GTX 670 equals it when we enable antialiasing.
Tom Clancy’s H.A.W.X. 2
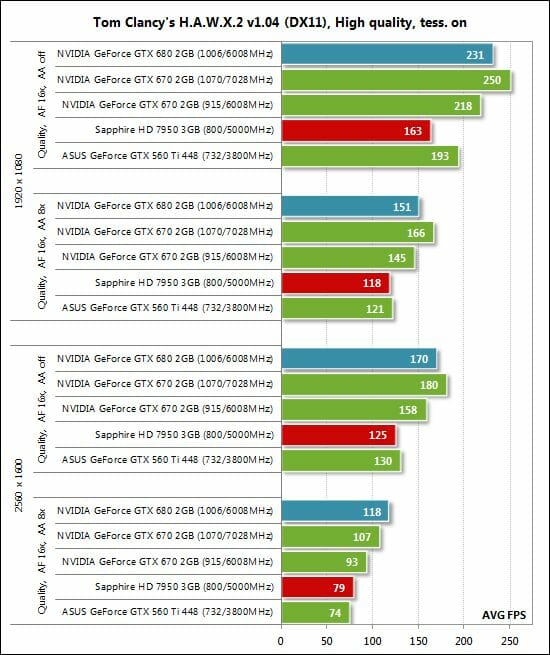
Nvidia strikes back in Tom Clancy’s H.A.W.X. 2, leaving their AMD opponent far behind. The overclocked GeForce GTX 670 is again faster than the more expensive GeForce GTX 680.
Total War: Shogun 2
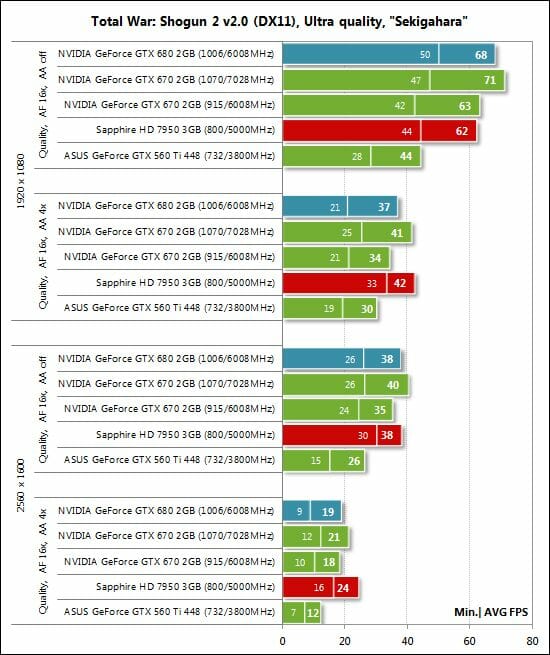
But then the Radeon HD 7950 scores a confident win in Total War: Shogun 2.
Crysis 2
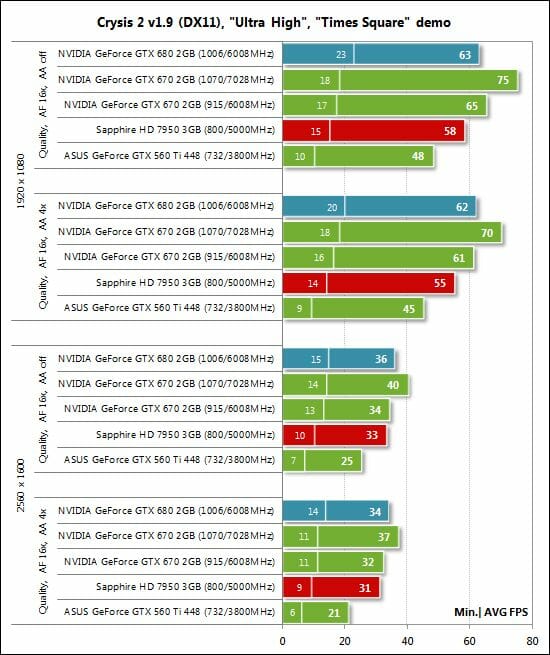
We’ve got normal standings again but the GeForce GTX 670 is a mere 3% ahead of its main opponent when antialiasing is turned on.
DiRT 3
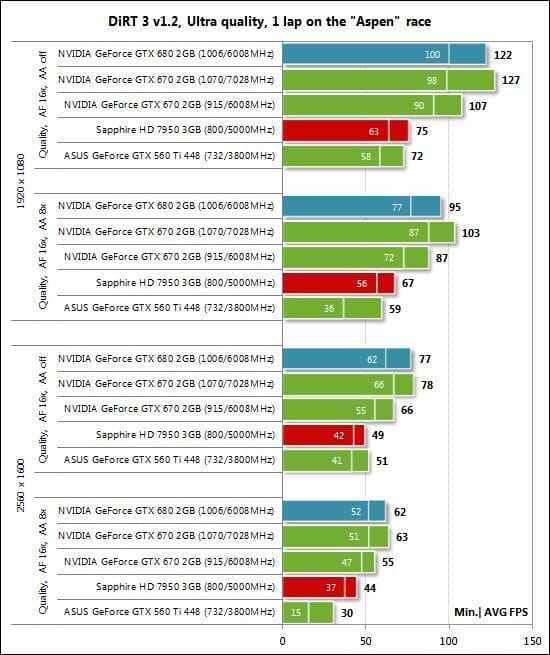
The GeForce GTX 670 is 25 to 43% ahead of the Radeon HD 7950 in DiRT 3 and, when overclocked, beats the GeForce GTX 680 as well.
Hard Reset Demo
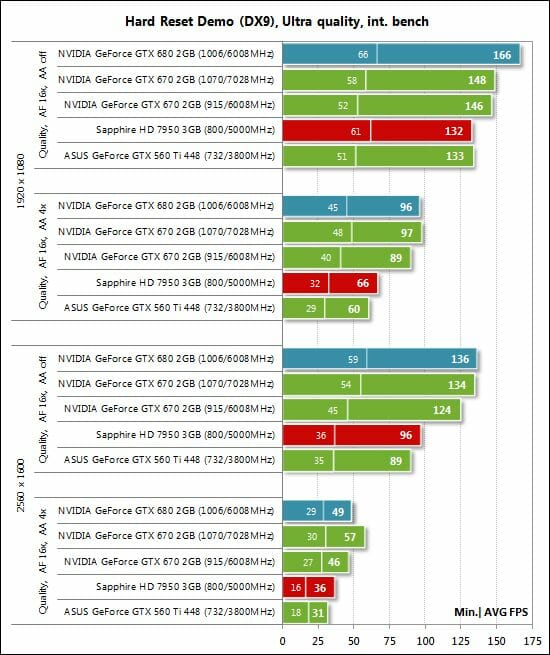
The Radeon HD 7950 is uncompetitive in Hard Reset. The standings are normal for this test session.
Batman: Arkham City
Battlefield 3
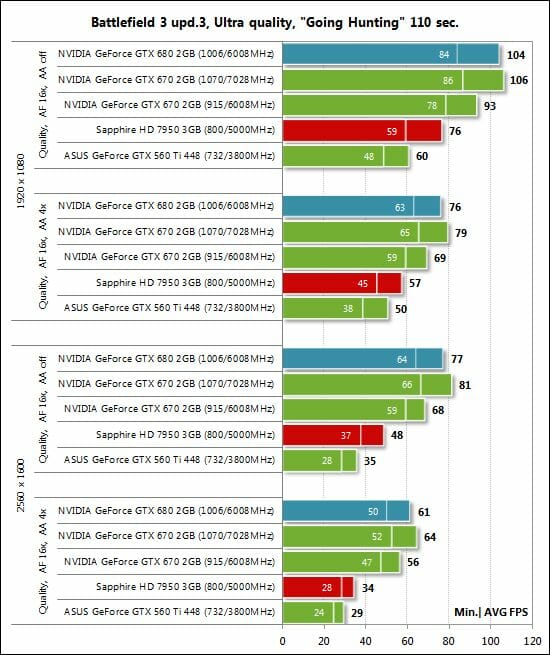
The GeForce GTX 670 wins two more tests: Batman: Arkham City and Battlefield 3.
Performance Summary
First, let’s see how large the gap is between the GeForce GTX 680 2GB at its default 1006/6008 MHz and the GeForce GTX 670 2GB at 915/6008 MHz.
The senior model isn’t much faster. Interestingly, it enjoys a larger advantage at 1920×1080 where the GeForce GTX 680 is an average 7-8% faster across all the tests. When we switch to 2560×1600 and the graphics memory bandwidth becomes a more important factor, the two cards differ less, by only 6-7% on average, just because they have the same memory bandwidth. Considering that the GeForce GTX 680 is 25% more expensive in terms of the recommended price, the few extra percent of performance doesn’t seem to be worth the $100 difference.
Moreover, when slightly overclocked to 1070/7028 MHz, the GeForce GTX 670 turns out to be faster than the GeForce GTX 680.The overclocked GTX 670 only fails to overtake the GeForce GTX in one test mode of Hard Reset and in Total War: Shogun 2. The average advantage of the overclocked GeForce GTX 670 over the default GTX 680 is 4-7% at 1920×1080 and 5-8% at 2560×1600.
And now let’s compare the GeForce GTX 670 2GB and the Radeon HD 7950 3GB at their default clock rates because their recommended (and retail) prices are identical, the Radeon’s results serving as the baseline.
Save for winning Sid Meier’s Civilization V and Total War: Shogun 2 in the antialiasing mode and delivering the same performance as its opponent in Metro 2033: The Last Refuge and the high-quality mode of Aliens vs. Predator (2010), the Radeon HD 7950 is inferior to the GeForce GTX 670. The latter is an average 20-29% faster at 1920×1080 and 19-32% faster at 2560×1600. By the way, the difference between the GeForce GTX 680 and Radeon HD 7970 was smaller in our earlier tests.
Now the final pair of summary diagrams helps us see the difference between the GeForce GTX 670 and GeForce GTX 560 Ti 448. Ideally, the new card should have been compared with the GeForce GTX 570 but we didn’t have the latter at hand during our tests. The GeForce 560 Ti 448 is in fact close to the GTX 570 in performance, so this comparison makes sense.
The GeForce GTX 670 is 43-45% faster than the GeForce GTX 560 Ti 448 at 1920×1080. The gap grows to 50-55% at 2560×1600. That’s good but the GTX 560 Ti 448 is about $110 cheaper than the GTX 670 (and the GTX 570, oddly enough, costs another $10-20 less).
Power Consumption
We measured the power consumption of computer systems with different graphics cards using a multifunctional panel Zalman ZM-MFC3 which can report how much power a computer (the monitor not included) draws from a wall socket. There were two test modes: 2D (editing documents in Microsoft Word and web surfing) and 3D (the benchmark from Metro 2033: The Last Refuge at 2560×1600 with maximum settings). Here are the results:
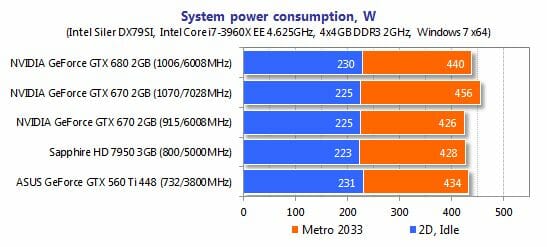
The systems with tested graphics cards are almost equal when it comes to power consumption. Comparing the new GeForce GTX 670 with the old GeForce GTX 560 Ti 448 Cores, we can see that the new card is 50% faster but needs less power, so the GK104 Kepler GPU is energy efficient indeed. Take note that the power consumption of the system with the overclocked GTX 670 only grows up by 30 watts. Even considering our six-core CPU overclocked to 4.6 GHz, any of these systems can be powered by a 500-550W PSU.
Conclusion
The Nvidia GeForce GTX 670 2GB has only one downside. It is too expensive. And the high price is largely due to psychological reasons rather than to its hardware properties we’ve studied in this review. Well, the GeForce GTX 670 is okay in terms of conventional pricing. It is $100 cheaper than the single-GPU flagship GeForce GTX 680 and as expensive as AMD’s Radeon HD 7950 ($399). However, it is hard to imagine that its 170mm PCB with a 28nm GPU, two gigabytes of memory (memory chips have been getting cheaper and cheaper these days) and its simple and noisy cooler really costs as much $399! We guess it should be priced at no more than $299, like a true replacement to the GeForce GTX 570 (and the 560 Ti 448 Cores).
Other than that, the GeForce GTX 670 is a highly attractive product that can deliver almost the same performance as the GeForce GTX 680 for less money, consuming less power and producing the same amount of noise.
At its default clock rates the new card is almost always faster than the AMD Radeon HD 7950, so we expect the latter’s price to be corrected in the near future. The GeForce GTX 670 also supports up to four monitors, Adaptive V-Sync and new antialiasing algorithms (FXAA and TXAA). It features the NVENC encoder and boasts high energy efficiency. It’s too early yet to talk about its overclocking potential, though. We need to wait for original versions with exclusive cooling systems.
The list below contains the most interesting GeForce GTX 670 graphics card models announced recently:
- ASUS GeForce GTX 670 DirectCU II (GTX670-DC2T-2GD5) 2 GB – 1058(1137)/6008 MHz;
- Gigabyte GeForce GTX 670 Ultra Durable (GV-N670OC-2GD) 2 GB – 980(1058)/6008 MHz;
- MSI GeForce GTX 670 (N670GTX-PM2D2GD5/OC) 2 GB – 965(1045)/6008 MHz;
- EVGA GeForce GTX 670 FTW (02G-P4-2678-KR) 2 GB – 1006(1084)/6208 MHz;
- Inno3D i-Chill GTX 670 Hercules 3000 2 GB – 1020(1071)/6208 MHz;
- ZOTAC GeForce GTX 670 AMP! Edition 2 GB – 1098(1176)/6608 MHz;
- Palit GeForce GTX 670 Jetstream (NE5X670H1042-1042J) 2 GB – 1006(1084)/6108 MHz.
We are going to review the last card on this list very shortly.