Areca ARC-1680ix-16 SAS RAID Controller Review

Back in the days, Areca ARC-1220 controller made such a great impression on us that we continued using it in our lab for a long time. We wonder if the new SAS RAID controller, which we will review today, manages to repeat the success of its predecessor.
About three years ago we got a SATA RAID controller ARC-1220 from the then-obscure Areca. It proved to be so good that it became the basis for the testbed we have used to benchmark HDDs in RAID arrays. Today, we’ve got another product from Areca called ARC-1680ix-16. It is based on a faster processor and supports SAS drives.
Like its opponents, Areca has released a whole generation of SAS-supporting products. The ARC-1300 series is the simplest, offering 4 to 16 SAS ports but no RAID functionality. The ARC-1212 and ARC-1222 series are full-featured RAID controllers that offer 4 and 8 external ports, respectively, and support all the standard array types. And finally, the ARC-1680 series provides the widest functionality, and it is an ARC-1680 series controller that we are going to test today.
Closer Look at Areca ARC-1680ix-16
The new series offers controllers to everyone’s taste: with external or external ports or a combination thereof. All models of the series fall into two groups: low-profile and full-size. The first group includes RAID controllers with 8 ports in all combinations. Areca is somewhat unclear on that point but it looks like all models of this group have more modest specs: a dual-core processor with a clock rate of 800MHz and 512 megabytes of DDR2-533 SDRAM.
The full-size models, including the 16-port sample that we’ve got, are somewhat more exciting. Their Intel IOP348 processor is clocked at 1.2GHz whereas their 512MB of memory is not soldered to the PCB but installed as a standard 240-pin DDR2-533 module with ECC. It means you can replace this module with a larger one if you want to. The manufacturer claims the controller support modules with capacities up to 4 gigabytes. We could not find an unbuffered 4GB module with ECC (a buffered module would not work) but a 2GB module worked normally.
The resulting controller specs match those of today’s entry-level PCs. We will test the controller with its default 512 megabytes of memory, though.
There are unusually many connectors at the controller’s bracket. The middle connector is an ordinary SFF-8088 (an external SAS connector for four ports). To the right of it there is an RJ-45 connector that allows managing the controller via an SNMP client. This is a useful and proper (for such a high-class controller) addition to the traditional management tools (BIOS settings and network control panel). The leftmost connector is RJ-11. It emulates an RS-232 port for upgrading SAS expanders’ firmware.
The kit contains more items than usual. Besides a traditional CD with drivers and software, user manual and cables, there is a cable with an RJ-11 plug on one end and an RS-232 plug on the other end. This cable is used to upgrade SAS expanders’ firmware. The user manual deserves our praise. You usually get a brief paper copy and a full version of the manual in electronic format, but here the controller comes with a 170-page book that details all of the device’s particulars and provides some general information about RAIDs.
The full list of supported array types is long enough and includes all popular as well as a few exotic (like RAID30) types of RAID. Here it is:
- Single HDD
- JBOD
- RAID0
- RAID1
- RAID1E
- RAID3
- RAID5
- RAID6
- RAID10
- RAID30
- RAID50
- RAID60
All ARC-1680 series controllers support a battery backup unit. If you’ve got an older Areca controller, you may be glad to hear that the BBU model has not changed.
As you can expect from a modern controller, the manufacturer’s website offers regularly updated firmware as well as drivers and an OS-based management utility that runs under Windows, Linux, FreeBSD, Solaris and Netware. You can also get a management information base for SNMP there.
Testbed and Methods
The following benchmarks were used:
- Intel IOMeter 2003.02.15
- WinBench 99 2.0
- FC-Test 1.0
Testbed configuration:
- Intel SC5200 system case
- Intel SE7520BD2 mainboard
- Two Intel Xeon 2.8GHz CPUs with 800MHz FSB
- 2 x 512MB PC3200 ECC Registered DDR SDRAM
- IBM DTLA-307015 hard disk drive as system disk (15GB)
- Onboard ATI Rage XL graphics controller
- Windows 2000 Professional with Service Pack 4
The controller was installed into the mainboard’s PCI-Express x8 slot. We used Fujitsu MBA3073RC hard disk drives for this test session. They were installed into the standard boxes of the SC5200 system case and fastened with four screws by the bottom panel. The controller was tested with four and eight HDDs in the following modes:
- RAID0
- RAID10
- Degraded 8-disk RAID10 with one failed HDD
- RAID5
- Degraded 8-disk RAID5 with one failed HDD
- RAID6
- Degraded 8-disk RAID6 with one failed HDD
- Degraded 8-disk RAID6 with two failed HDDs
As we try to cover all possible array types, we will publish the results of degraded arrays. A degraded array is a redundant array in which one or more disks (depending on the array type) have failed but the array still stores data and performs its duties.
For comparison’s sake, we publish the results of a single Fujitsu MBA3073RC hard disk on an LSI SAS3041E-R controller as a kind of a reference point. We want to note that this combination of the HDD and controller has one known problem: its speed of writing in FC-Test is very low.
The stripe size was set at 64KB for each array type.We used the latest BIOS available at the manufacturer’s website for the controller and installed the latest drivers. The BIOS was version 1.46 and the driver was version 20.0.14.
Performance in Intel IOMeter
Database Patterns
In the Database pattern the disk array is processing a stream of requests to read and write 8KB random-address data blocks. The ratio of reads to writes is changing from 0% to 100% (stepping 10%) throughout the test while the request queue depth varies from 1 to 256.
We will be discussing graphs and diagrams but you can view the data in tabled format using the following links:
The RAID0 and RAID10 arrays behave normally at a queue depth of 1 request. The controller’s writing performance scales up depending on the number of HDDs in the array. The 4-disk RAID0 almost coincides with the 8-disk RAID10: a mirror pair is equivalent to one disk at writing. It is good that the degraded array doesn’t differ from the healthy one.
The checksum-based arrays are all right, too. The degraded RAID6 with two failed disks is considerably slower than the single HDD while the other arrays behave normally except that we’d expect a higher write speed from the multi-disk arrays considering the fast HDDs and the controller’s large amount of memory and high-performance processor. We will discuss this in more detail in our upcoming comparative review of several RAID controllers.
When the queue is 16 requests deep, the arrays all speed up. They use deferred writing more actively and enable request reordering. The standings of the arrays are just as expected, but the controller might be more effective at choosing the luckier disk in a mirror pair. We have seen other controllers deliver higher performance when reading from a RAID10 than from a same-size RAID0. Here, such arrays are only equals.
The RAID5 and RAID6 arrays have some problems with writing: the controller should be faster with these heavy-to-operate arrays because it has such a high-speed processor on board (we saw the effect of a fast processor in our Adaptec ASR-5808 review). The RAID6 arrays which require two checksums to be calculated simultaneously suffer the most.
One interesting thing can be noted at the longest queue depth. Maximum performance is achieved at mixed loads that combine both write and read requests. While individual HDDs find such loads to be the most difficult, modern RAIDs deliver their best under them by combining effective request reordering in the long queue with a large deferred writing buffer. If you have read our RAID controller reviews, you may have noticed that the peak of performance falls on different writes-to-reads ratios with different controllers. It’s because each manufacturer has its own approach to firmware optimizations, giving more priority to reading or to deferred writing.
The degraded RAID10 is good. Of course, it is not as fast as its healthy counterpart at high percentages of reads, yet its speed never falls to the level of the 4-disk RAID0.
There are no changes among the RAID5 and RAID6 arrays at high loads. They all cope with reading successfully and slow down at writing. As for the degraded arrays, the RAID5 without one disk slows down too much at reading.
Disk Response Time
IOMeter is sending a stream of requests to read and write 512-byte data blocks with a request queue depth of 1 for 10 minutes. The disk subsystem processes over 60 thousand requests, so the resulting response time doesn’t depend on the amount of cache memory.
The first thing we can see here is that all the RAIDs are somewhat worse than the single HDD. This is logical because the controller cannot but introduce some latency. However, the RAID10 might have been better than the single HDD by choosing what disk in a mirror pair can provide the requested data faster. We have seen other controllers do that. The 8-disk arrays are all faster than the 4-disk ones which, in their turn, are better than the degraded arrays. The latter do well in this test. Recovering data from checksums has a notable effect only on the performance of the RAID6 with two failed HDDs: recovering that much data is a heavy load that provokes a reduction of the disk subsystem’s response.
We see an odd picture at writing. On one hand, the RAID0 and RAID10 arrays have predictable standings: the larger the total cache of the HDDs and controller, the lower the response time is. But on the other hand, there is no order in the results of the checksum-based arrays. For example, the 4-disk RAID5 is inferior to the 4-disk RAID6. And the latter is even ahead of the 8-disk RAID6.
Random Read & Write Patterns
Now we’ll see the dependence of the arrays’ performance in random read and write modes on the size of the processed data blocks.
We will discuss the results of the arrays at processing random-address data in two variants. For small-size data chunks we will draw graphs showing the dependence of the amount of operations per second on the data chunk size. For large chunks we will compare performance depending on data-transfer rate in megabytes per second. This approach helps us evaluate the disk subsystem’s performance in two typical scenarios: working with small data chunks is typical of databases. The amount of operations per second is more important than sheer speed then. Working with large data blocks is nearly the same as working with small files, and the traditional measurement of speed in megabytes per second is more relevant for such load.
We will start out with reading.
When the arrays are reading small random-address data blocks, the overall typical picture has one inexplicable element: the degraded RAID10 is ahead of all the others on 8KB data chunks.
There are no surprises among the RAID5 and RAID6 arrays. The arrays are all slower than the single HDD. The large (8-disk) arrays are the fastest while the degraded arrays are the slowest here.
The RAID10 betray some problems on large data blocks. For example, they are slower than the single HDD on 8MB blocks and obviously slower than expected on large blocks, too. This problem can be seen with every array irrespective of the number of disks. It means the controller’s firmware is not perfect.
When reading in large data blocks, the healthy RAID5 and RAID6 arrays show good performance whereas the degraded ones are all slow. The RAID5 is especially bad after losing one disk.
Random writing goes next.
Everything is all right when the RAID0 and RAID10 arrays are writing in small data blocks. They show ideal scalability of performance depending on the number of disks. The degraded array is no different from the healthy one.
The number of disks is still important when the controller is writing to RAID5 and RAID6 arrays but the checksum calculations affect the performance, too. Two checksums must be calculated for RAID6, so there is a small difference between the 8-disk and 4-disk RAID6s. The degraded arrays all slow down. In order to write a block, they have to read previously written data, some of which have to be restored from checksums.
This group of arrays would be perfect in this test if the 4-disk RAID10 did not slow down that much on very large blocks. As a result, this array falls behind the single HDD.
The controller successfully copes with writing large blocks to RAID5 and RAID6 arrays. The large blocks allow it to reduce the number of disk accesses. The controller does not have to read anything in order to write a full stripe. As a result, the degraded arrays are almost as fast as their healthy counterparts. The only exception is the 4-disk RAID6 that has a very low speed, just like the RAID10 in the previous diagram.
Sequential Read & Write Patterns
IOMeter is sending a stream of read and write requests with a request queue depth of 4. The size of the requested data block is changed each minute, so that we could see the dependence of an array’s sequential read/write speed on the size of the data block. This test is indicative of the highest speed a disk array can achieve.
The controller boasts a high speed of sequential reading. The RAID10 arrays try to read even small data blocks from both disks of a mirror pair simultaneously, increasing the resulting performance. They cannot match the RAID0 arrays but the result is good overall: this part of the controller’s firmware is very efficient.
Take note that the degraded RAID10 coincides with the RAID0 built out of half the number of disks. It looks like the controller does not try to read data from mirror pairs simultaneously anymore irrespective of whether the pair is healthy or not.
The full-featured RAID5 and RAID6 draw nice-looking graphs whereas their degraded versions are good with small data blocks but slow with large blocks.
The RAID10 behave somewhat oddly at sequential writing. The 4-disk RAID10 is very slow. Its low speed in the test of writing large random-address data blocks must have been due to that. This is a very odd behavior. The 8-disk RAID10 acts up, too. Its speed is somewhat lower than that of the degraded RAID10, which in its turn is expectedly equal to the 4-disk RAID0.
The problems with writing in large data blocks can be observed again. Here, the 4-disk RAID6 is extremely slow. The other healthy arrays are good enough, producing neat graphs.
As for the degraded arrays, the RAID6 are almost as fast as their healthy counterpart even on rather small data blocks which are far smaller than a full stripe. The RAID5 slows down greatly when one of its disks fails.
Multithreaded Read & Write Patterns
The multithreaded tests simulate a situation when there are one to four clients accessing the virtual disk at the same time, the number of outstanding requests varying from 1 to 8. The clients’ address zones do not overlap. We will discuss diagrams for a request queue of 1 as the most illustrative ones. When the queue is 2 or more requests long, the speed doesn’t depend much on the number of applications.
- IOMeter: Multithreaded Read RAID1+RAID10
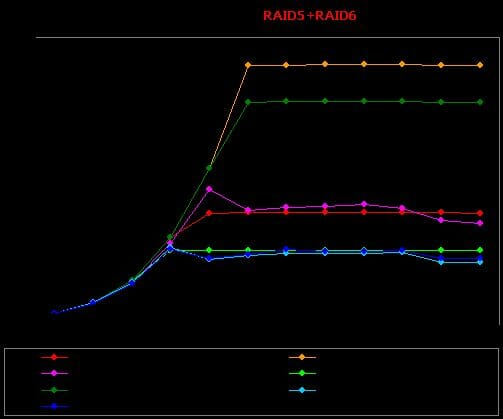
- IOMeter: Multithreaded Read RAID5+RAID6
- IOMeter: Multithreaded Write RAID1+RAID10
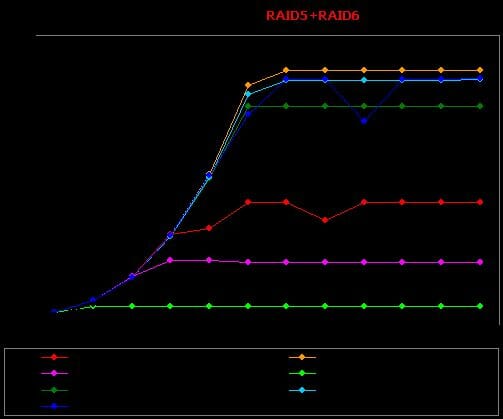
- IOMeter: Multithreaded Write RAID5+RAID6
The arrays are very fast when reading one data thread. While most other controllers reach their max speeds at queue depths longer than 1, the Areca ARC-1680 delivers a high sequential read speed even at the shortest queue depth.
The controller is less successful with two threads, though. Most of the arrays deliver only two thirds of their speed with one thread, and the 8-disk RAID5 and RAID6 suffer a twofold performance hit. On the other hand, the RAID10 feel all right and even speed up a little: the controller recognized the type of load and sent one thread to each disk in a mirror pair. The speed of the degraded RAID6 is higher, too, but this must be a peculiarity of the controller’s firmware rather than a deliberate optimization.
When there are more threads to be processed, the arrays slow down steadily, but the standings do not change much. It is good that the controller is able to send the different threads to different disks of mirror pairs in RAID10 arrays.
When the queue is 1 request deep, the controller is somewhat worse at writing one thread than at reading, but the speeds are high enough for it to avoid our criticism. However, we can again see the familiar problem: the 4-disk RAID10 and RAID6 have very low performance.
Some of the arrays slow down expectedly when we add a second thread, but others, on the contrary, speed up. Particularly, the 8-disk RAID0 and RAID5, including the degraded RAID5, accelerate eagerly.
There are no changes in the standings when third and fourth threads are added: the arrays just slow down steadily.
Web-Server, File-Server, Workstation Patterns
The controllers are tested under loads typical of servers and workstations.
The names of the patterns are self-explanatory. The request queue is limited to 32 requests in the Workstation pattern. Of course, Web-Server and File-Server are nothing but general names. The former pattern emulates the load of any server that is working with read requests only whereas the latter pattern emulates a server that has to perform a certain percent of writes.
- IOMeter: File-Server
- IOMeter: Web-Server
- IOMeter: Workstation
- IOMeter: Workstation, 32GB
The RAID0 and RAID10 arrays built out of the same number of disks deliver the same performance in this reads-only pattern.The same goes for the RAID5 and RAID6 arrays: they are almost equals. The graphs of the degraded arrays nearly coincide, too.
The performance ratings suggest that when the load is pure reading, it is the amount of disks in the array that’s important with this RAID controller while the type of the array is insignificant.
As soon as there are write requests to be processed, the RAID0 become faster than the RAID10. The degraded 8-disk RAID10 is better than the 4-disk RAID0, so some of the optimization algorithms are still at work.
In the same way, the RAID6 arrays are inferior to the RAID5 ones under this load because they have to process twice the amount of checksums. There is a difference between the degraded arrays, too. Restoring data from two checksums to do a write is not “free” anymore.
Take note that the checksum-based arrays are worse than the RAID10, let alone the RAID0.It is like in the previous test, but the noted peculiarities are more conspicuous because the Workstation pattern contains a larger share of writes.
Now the 8-disk RAID5 and RAID6 arrays can only compete with the 4-disk RAID0 while their 4-disk versions are hardly different from the single HDD. The degraded arrays are downright poor in this test.
It’s roughly the same when the test zone is limited to 32GB. The multi-disk arrays speed up because the working zone of each HDD is very narrow and the HDD’s heads travel by very short distances.
Performance in FC-Test
For this test two 32GB partitions are created on the virtual disk of the RAID array and formatted in NTFS and then in FAT32. Then, a file-set is created on it. The file-set is then read from the array, copied within the same partition and then copied into another partition. The time taken to perform these operations is measured and the speed of the array is calculated. The Windows and Programs file-sets consist of a large number of small files whereas the other three patterns (ISO, MP3, and Install) include a few large files each.
We’d like to note that the copying test is indicative of the array’s behavior under complex load. In fact, the array is working with two threads (one for reading and one for writing) when copying files.
This test produces too much data, so we will only discuss the results of the Install, ISO and Programs patterns in NTFS which illustrate the most characteristic use of the arrays. You can use the links below to view the other results:
Everything is normal in the file creation test when it comes to small files. It is the ISO pattern that reveals problems such as the extremely low speed of the 4-disk RAID10 (we really wonder what is so wrong with it) and the low (relative to the other arrays) speed of the 8-disk RAID0. However, the controller is overall very good. Most of its opponents cannot deliver a data-transfer rate of 300MBps in the ISO pattern.
The speeds are lower when the controller is writing to RAID5 and RAID6 arrays. The standings are predictable enough but we wish the 8-disk RAIDs were faster.
We can see the controller being very effective at reading large ISO files: 650MBps is a very good speed. In fact, it is the best result we have seen so far. There are minor problems with small files, though. The 8-disk RAID0 is unexpectedly slow with them.
The controller really seems to have some problems with small files. The 4-disk RAID5 and RAID6 are faster than their 8-disk counterparts in the Install and Programs patterns. The 8-disk arrays show their best with large ISO files, delivering a data-transfer rate of 650MBps!
The 8-disk RAID10 is suddenly ahead of all its opponents including the RAID0. The speeds in the ISO pattern are high but the controller sets no records when processing smaller files. Well, you will see better how the controller compares with other brands’ products in our upcoming review.
The checksum-based arrays do the copying without any fuss. The controller is still good with large files but far from brilliant with small ones. The arrays’ standings are predictable, which is good.
Performance in WinBench 99
Finally, here are data-transfer graphs recorded in WinBench 99.
- Data-transfer graph for a single Fujitsu MBA3073RC disk on the LSI controller
And these are the data-transfer graphs of the RAID arrays built on the Areca ARC-1680ix-16 controller:
The following diagram compares the read speeds of the arrays at the beginning and end of the partitions created on them.The results are good because every array takes its deserved and expected place. The data-transfer graphs show low fluctuations of speed and no flat stretches. Even the degraded arrays work normally, excepting the RAID5.
Conclusion
Areca has almost managed to hold its honorable and obliging title of the maker of very good RAID controllers. We say almost because we do not like the problems with writing to 4-disk RAID10 and RAID6. Besides, the controller’s efficiency in choosing the luckier disk in a mirror pair is not perfect and it might be faster at processing small files. Hopefully, the manufacturer will address these issues in firmware updates.
The good thing about this controller is that it is fast and stable under server loads and has no rivals at processing large files. It can also effectively parallel multithreaded load between disks of mirror pairs. Summing it up, the Areca ARC-1680 seems to be an excellent choice for a high-load file server.