AMD Radeon R9 290 4 GB Review

We have tested the younger model of Hawaii XT graphics card. What is performance drop compared to Radeon R9 290X? Can Radeon R9 290 be a powerful rival against Nvidia’s GPUs? Check out our extensive review.
The Radeon R9 290 is the second AMD card (after the flagship Radeon R9 290X) that comes with the new Hawaii XT GPU. Featuring the same Graphics Core Next architecture, this Hawaii XT-based product has a 5% lower top clock rate, 9% fewer unified shader processors and texture-mapping units, and a 27% lower recommended price. These are, in fact, all the differences between the two models. The only thing left for us to check out is how the Radeon R9 290 compares with the top-end R9 290X and with its market opponent GeForce GTX 780 in terms of performance. These are the issues we’re going to cover in this review.
Specifications and Recommended Price
The AMD Radeon R9 290 specifications are listed in the following table in comparison with the reference AMD Radeon R9 290X, AMD Radeon R9 280X and Nvidia GeForce GTX 780:
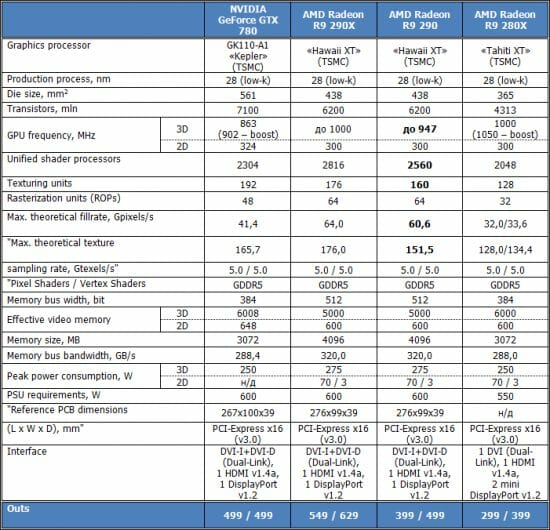
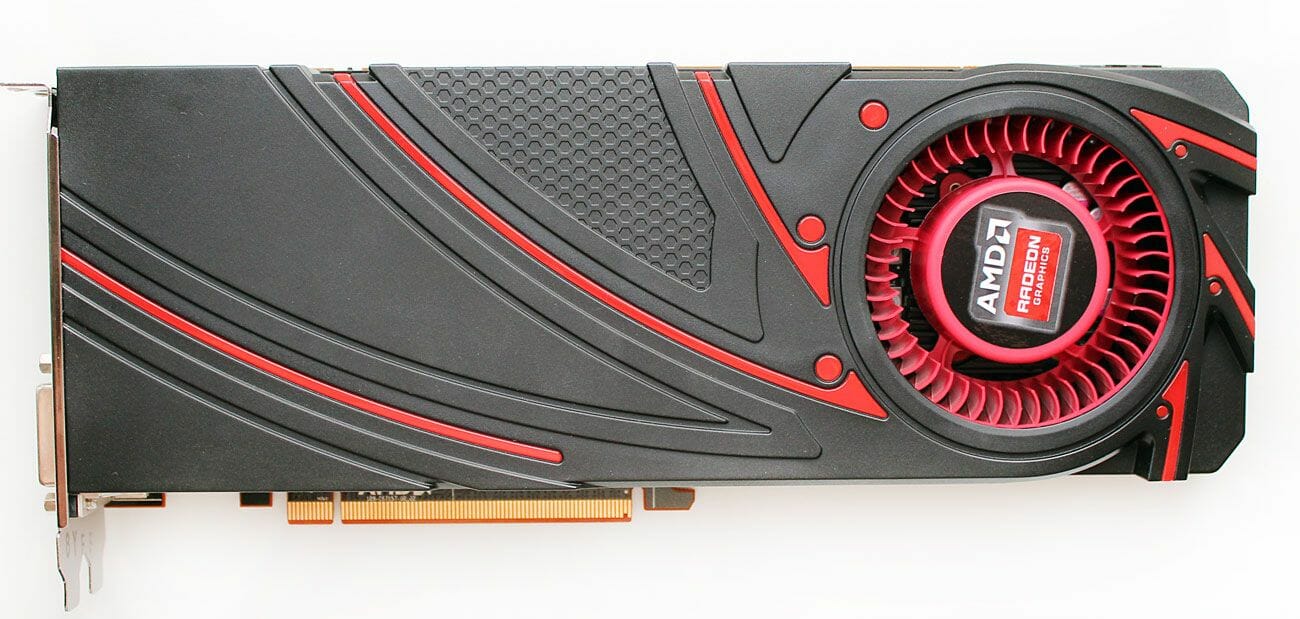
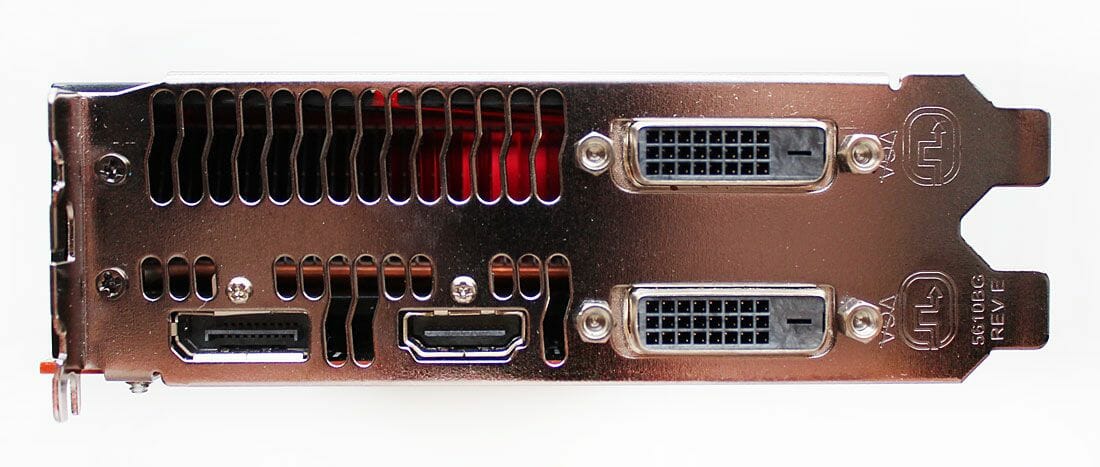
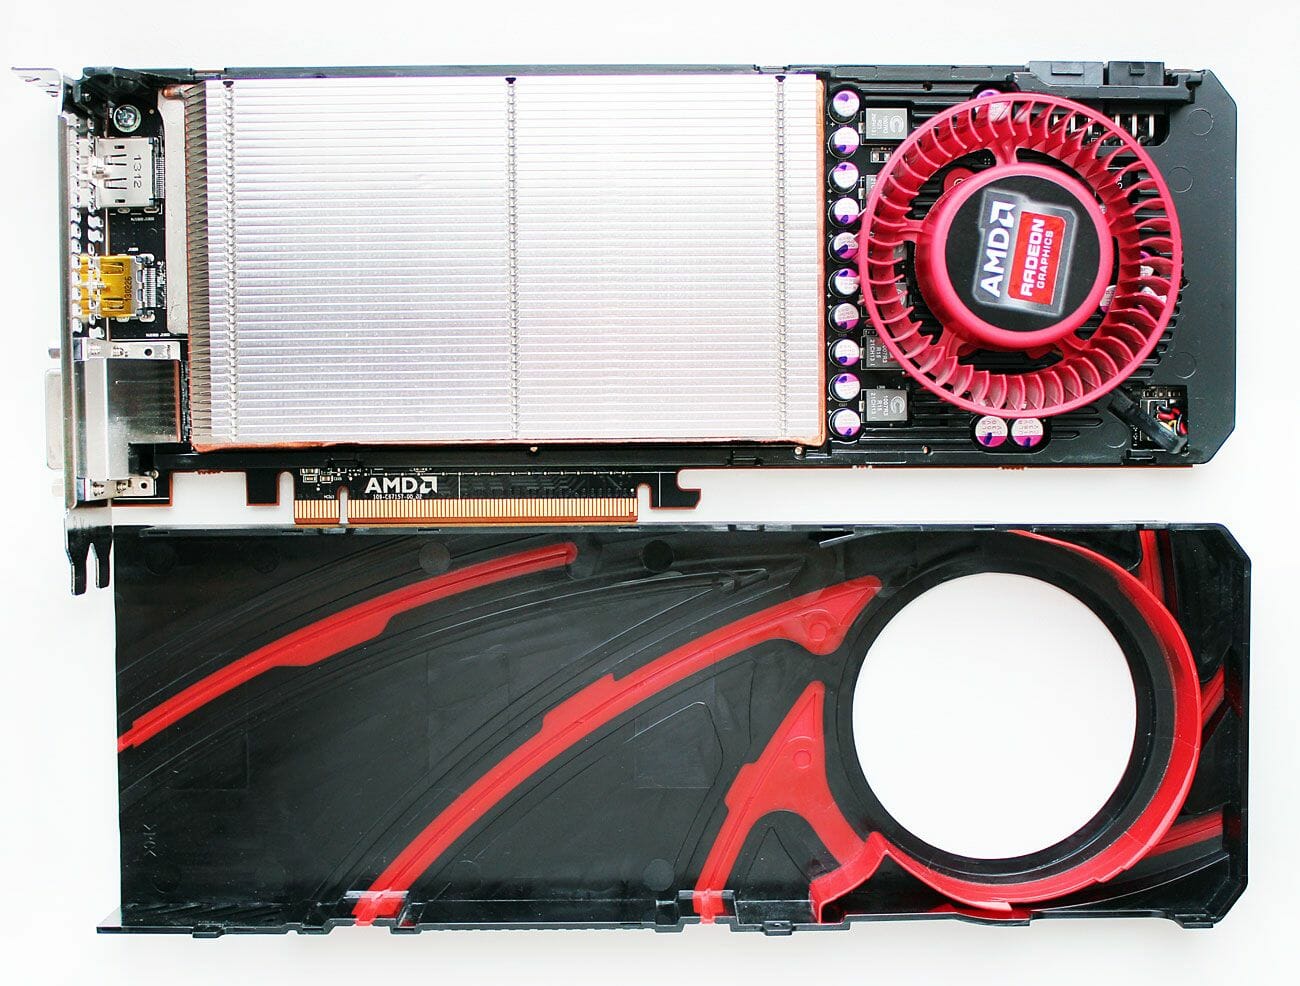
The card measures 276x99x39 millimeters and has the same video outputs as its senior cousin: two dual-link DVI outputs, one HDMI 1.4a, and one DisplayPort version 1.2.

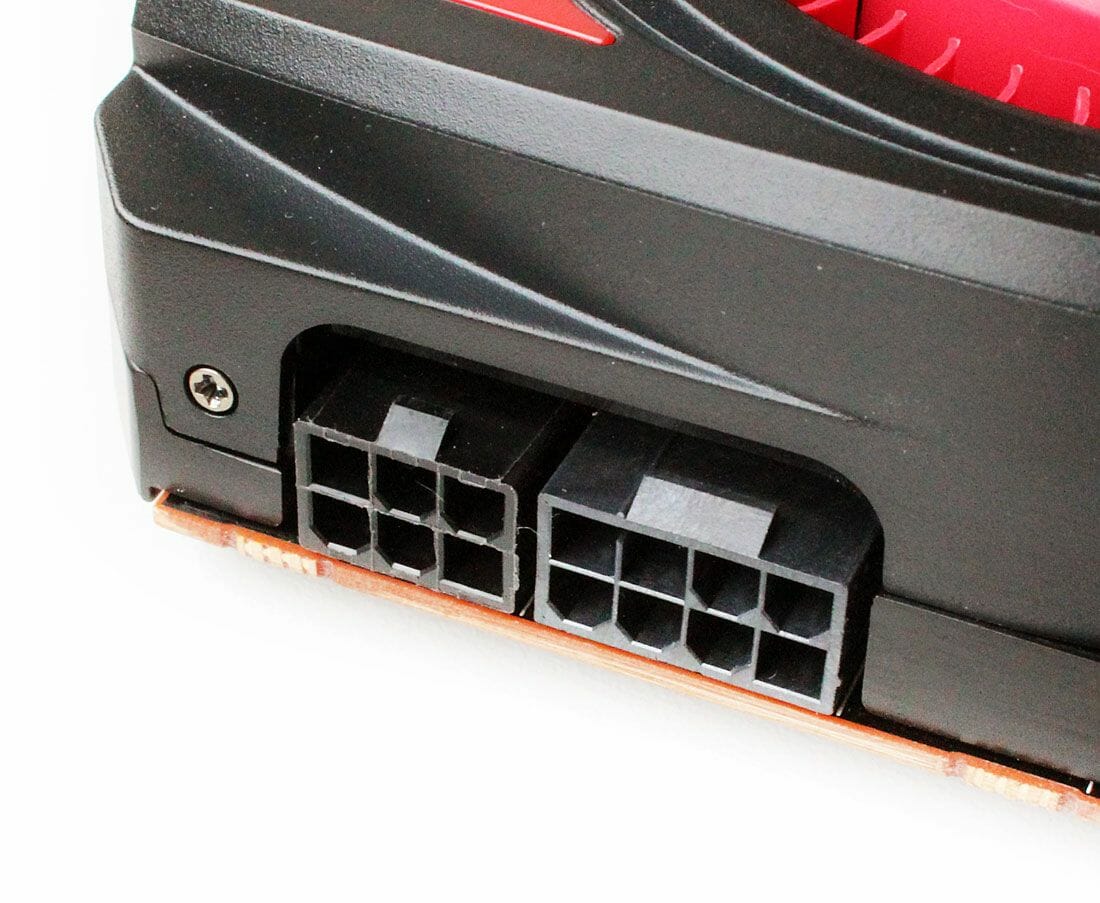
The new Radeon R9 series lack CrossFireX connectors. As for the power supply, there is one 6-pin and one 8-pin connector, just like on the senior Radeon R9 290X.
The Radeon R9 290 is specified to have a peak power draw of 275 watts.
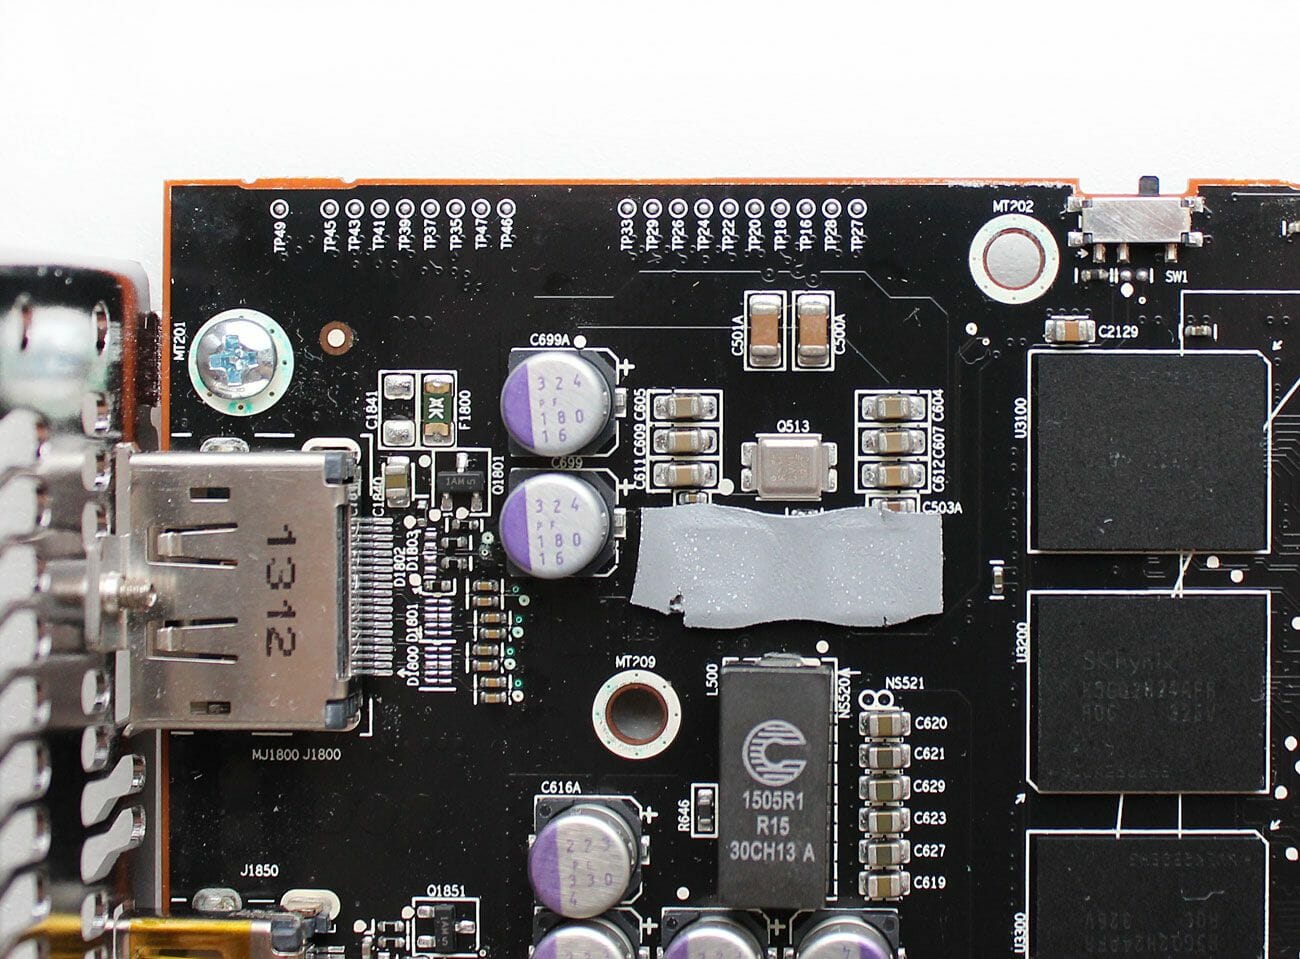
Instead of the missing CrossFireX connectors we have a BIOS switch for choosing the cooler’s operation mode: Uber or Quiet.
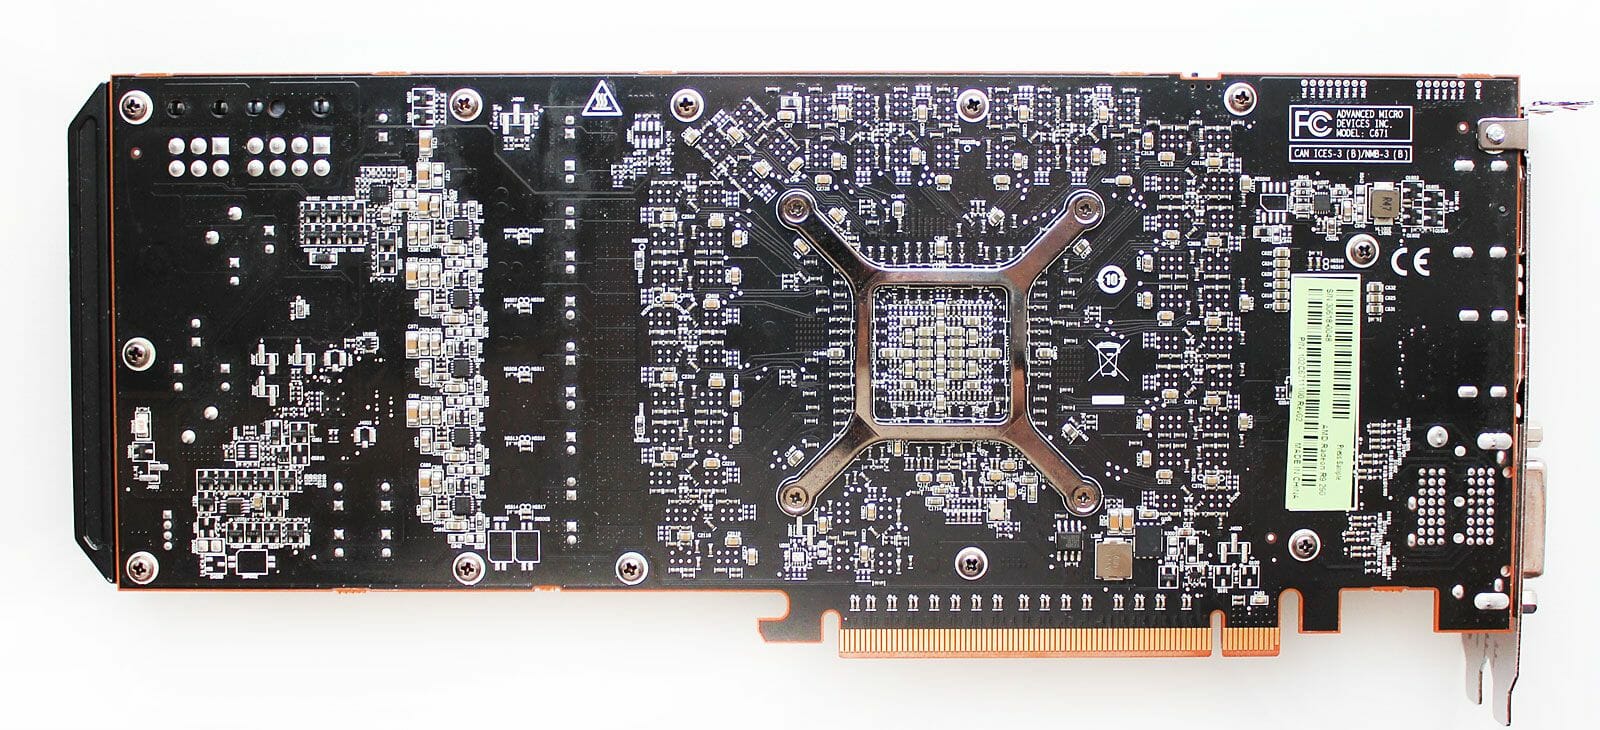
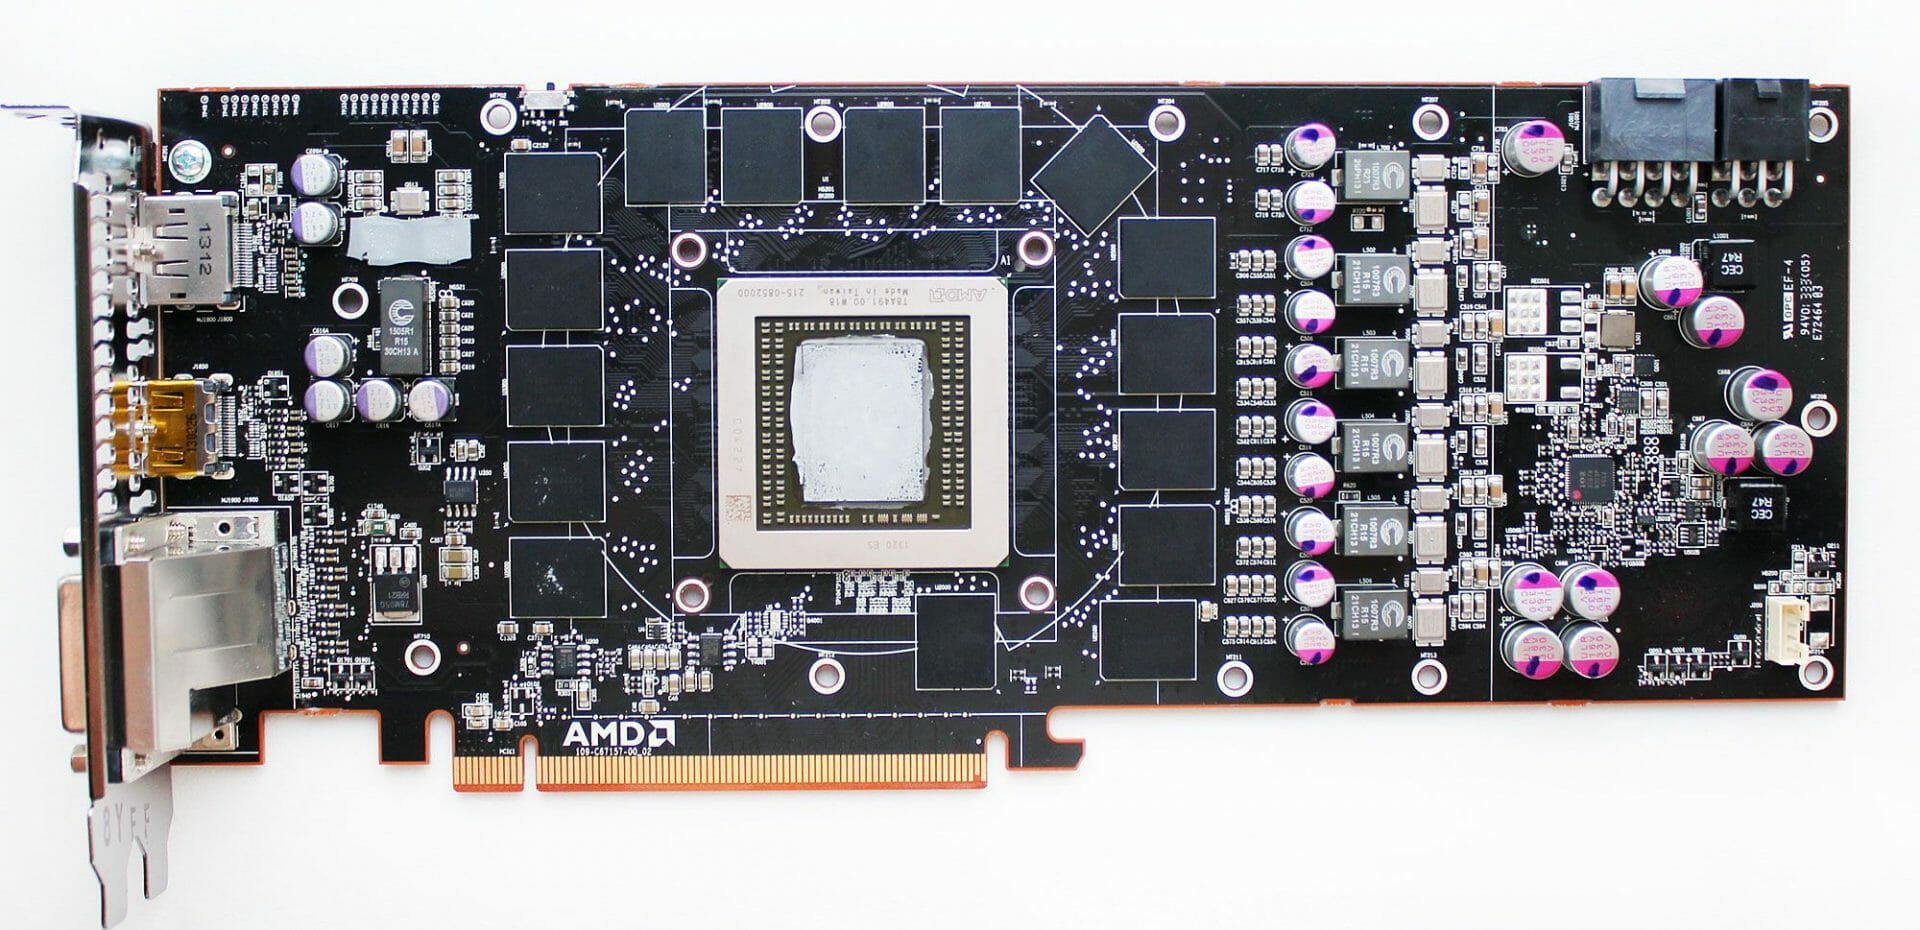
The PCBs of the reference Radeon R9 290 and R9 290X are identical.
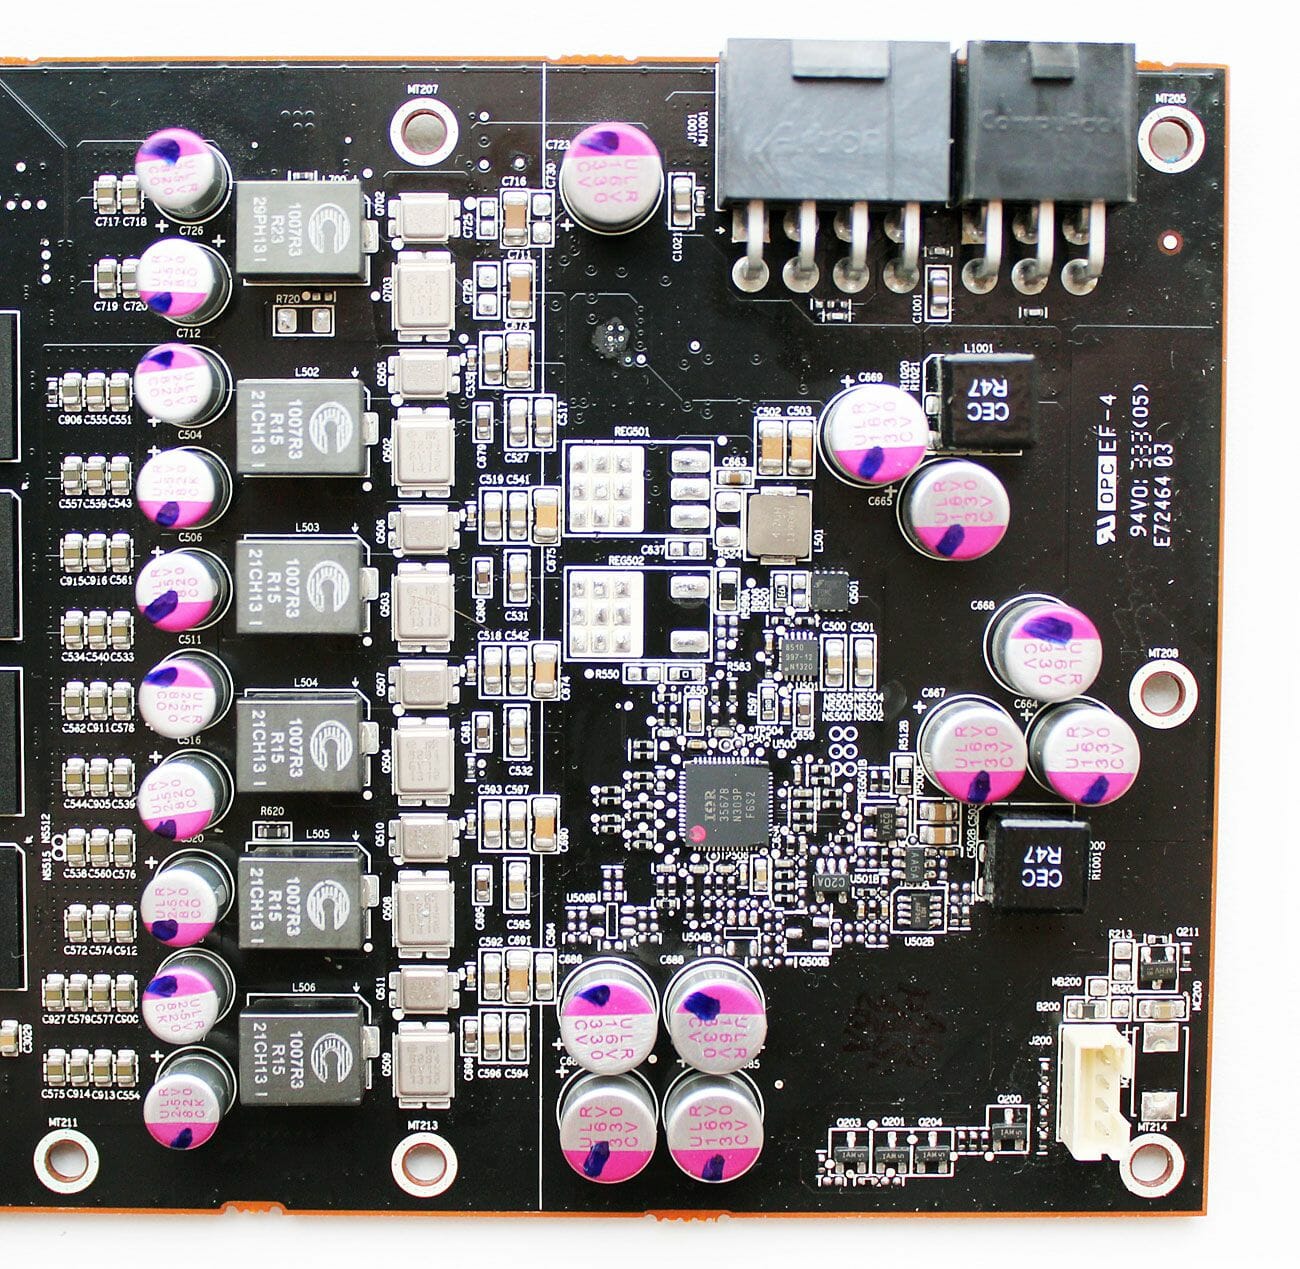
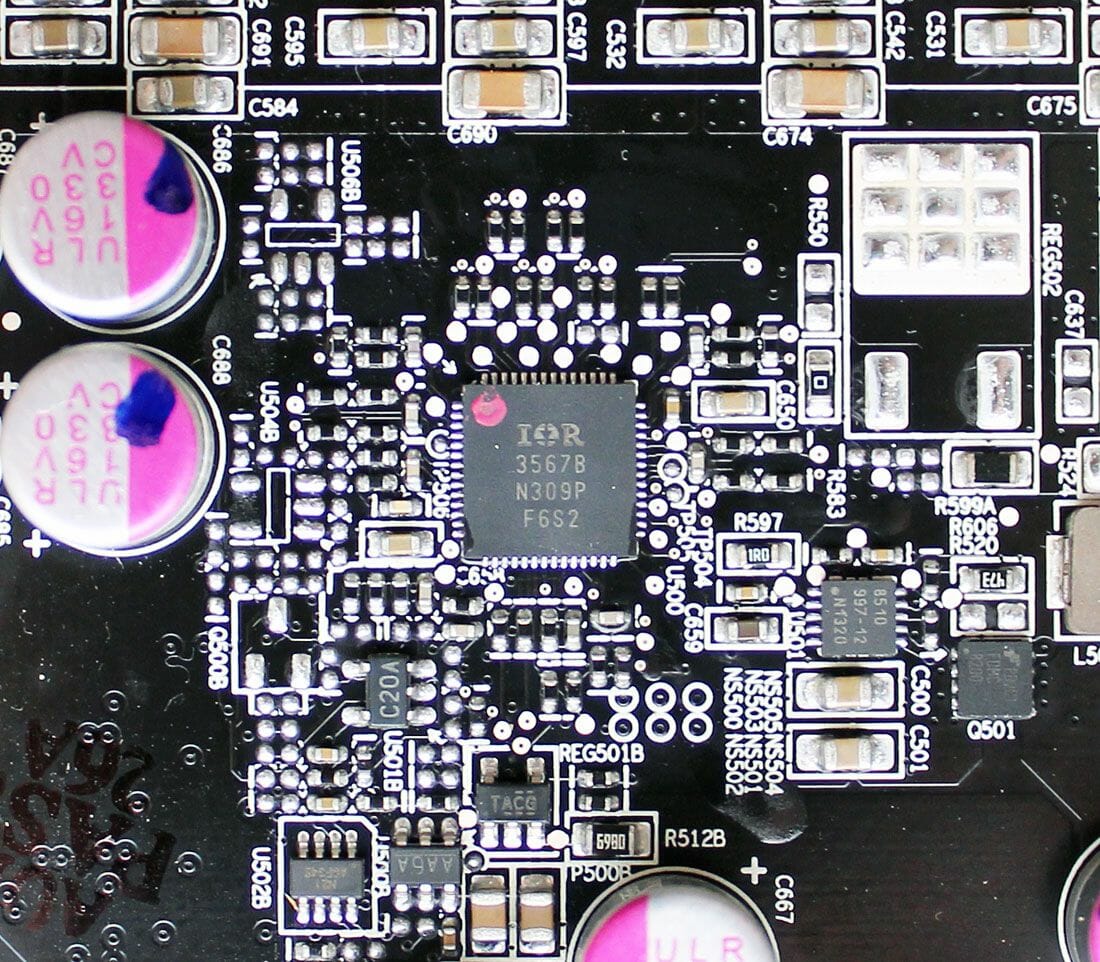
The GPU voltage regulator incorporates five phases with DirectFET transistors. There are also one power phase for the memory chips and one for PLL.
The power system is based on an IR3567B controller:
The Hawaii XT GPU of our Radeon R9 290 was manufactured on the 20th week of 2013 (in mid-May). Otherwise, this 438 sq. mm chip is identical to the one we saw on our R9 290X.
If you’ve skipped over the Introduction and Specifications, we can remind you that the GPU of the Radeon R9 290 has 2560 unified shader processors, 160 texture-mapping units, and 64 raster operators. In 3D applications it can work at clock rates up to 947 MHz, depending on load and temperature. In 2D applications its clock rate drops down to 300 MHz while the voltage is lowered from 1.148 to 0.977 volts. The latter is only true for our sample of the card and may be different with other samples.
The ASIC quality of our GPU is 83.2%, which is higher than the ASIC quality of the GPU of the reference Radeon R9 290X we tested earlier (76.2%).
Overclockers were interested in the opportunity to unlock the disabled shader processors in the Radeon R9 290 and some did succeed in doing that. To check out the opportunity of unlocking the card to the level of a Radeon R9 290X, you need to download and launch the Hawaii info utility:
If the “Rx1” strings all contain “F8000005”, it is highly likely that the card can be unlocked by using the BIOS of the Radeon R9 290X. The detailed instructions can be found here. We are not that lucky with our sample, though. Anyway, that’s not a big loss as you’ll see in our performance tests.
The Radeon R9 290 comes with 4 gigabytes of GDDR5 memory in FCBGA chips from SK Hynix (marked as H5GQ2H24AFR R0C):
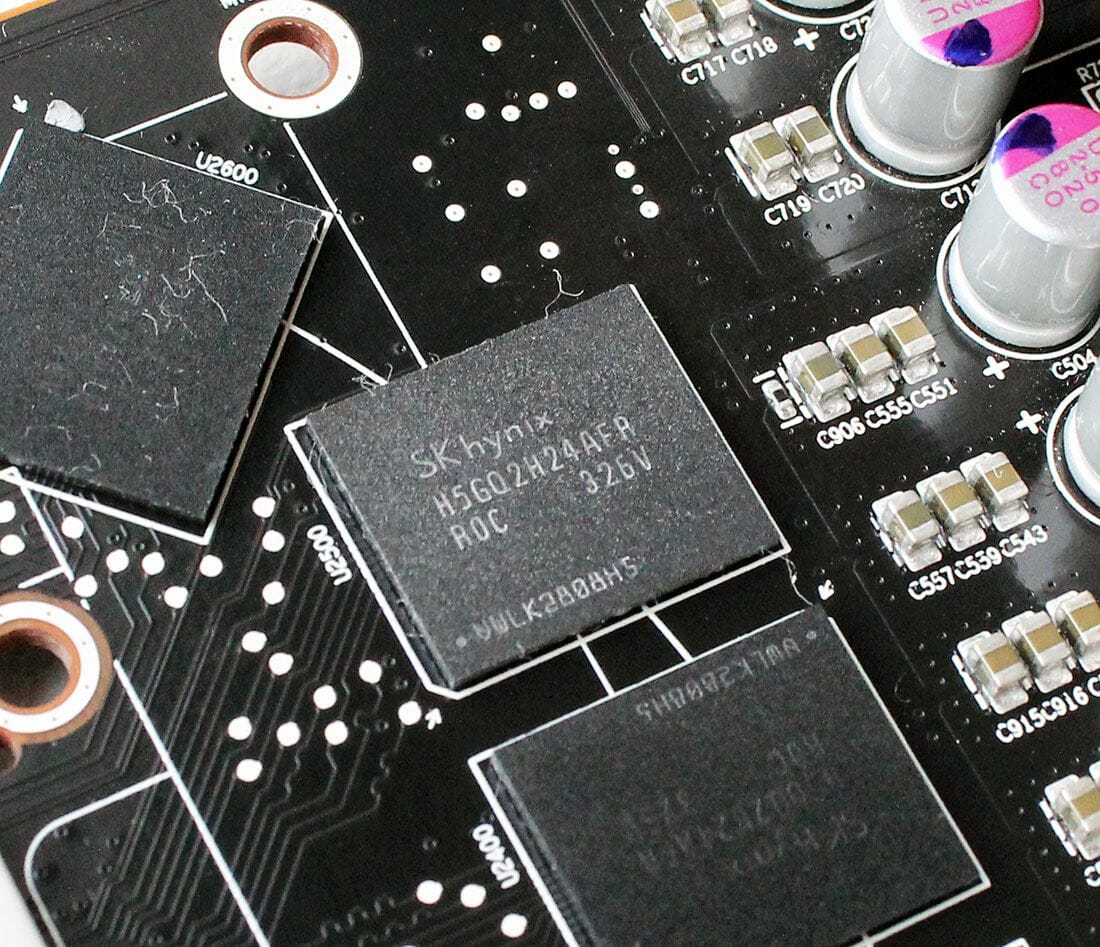
Rated for 6000 MHz, the chips are clocked at 5000 MHz on the Radeon R9 290, ensuring a peak bandwidth of 320 GB/s. So, the R9 290 is exactly like the senior R9 290X in this respect.
Here is a summary of the Radeon R9 290 specs.
Now we can move on to testing its cooler.
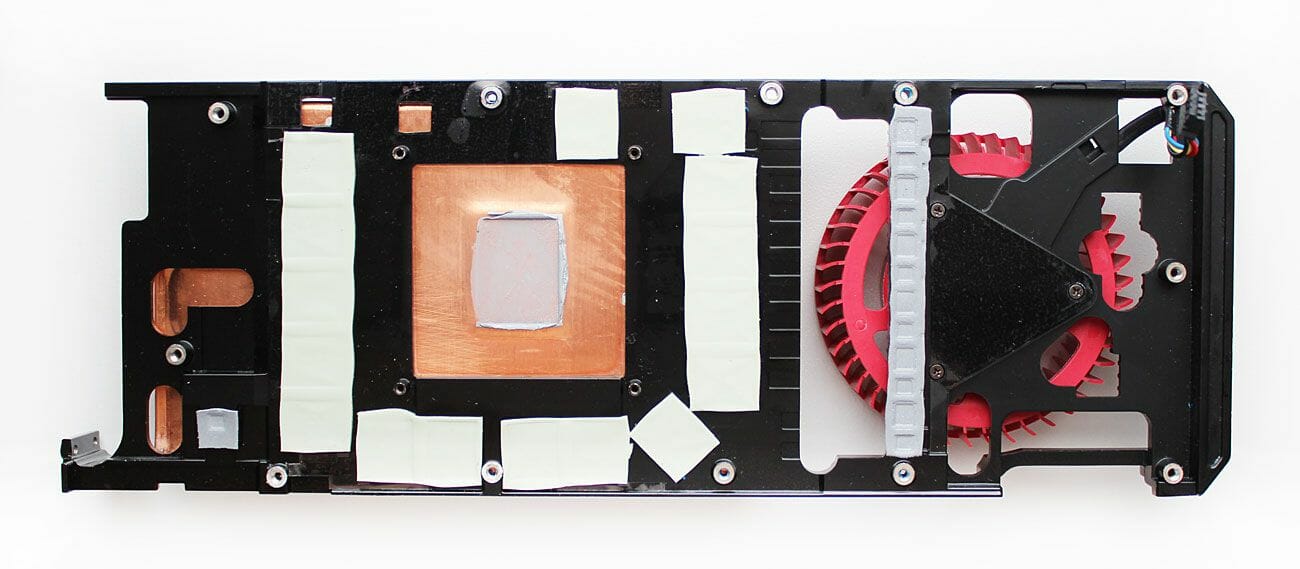
The reference Radeon R9 290 is equipped with the same cooler as the Radeon R9 290X with a plastic casing, an aluminum heatsink with a copper vapor chamber, a steel heat-spreading plate, and a 70mm radial fan.
Gray-colored thermal grease and two types of thermal pads are used as thermal interfaces.
To measure the temperature of the graphics card we ran Aliens vs. Predator (2010) five times at the maximum visual quality settings, at a resolution of 2560×1440 pixels, with 16x anisotropic filtering and with 4x MSAA.
We used MSI Afterburner 3.0.0 beta 17 and GPU-Z version 0.7.4 and 0.7.5 to monitor temperatures inside the closed computer case. The computer’s configuration is detailed in the following section of our review. All tests were performed at 25°C room temperature.
When the cooler’s fan was regulated automatically, we had almost the same picture as with the top-end Radeon R9 290X. The GPU’s clock rate and voltage would drop down – just not as hard as with the R9 290X.
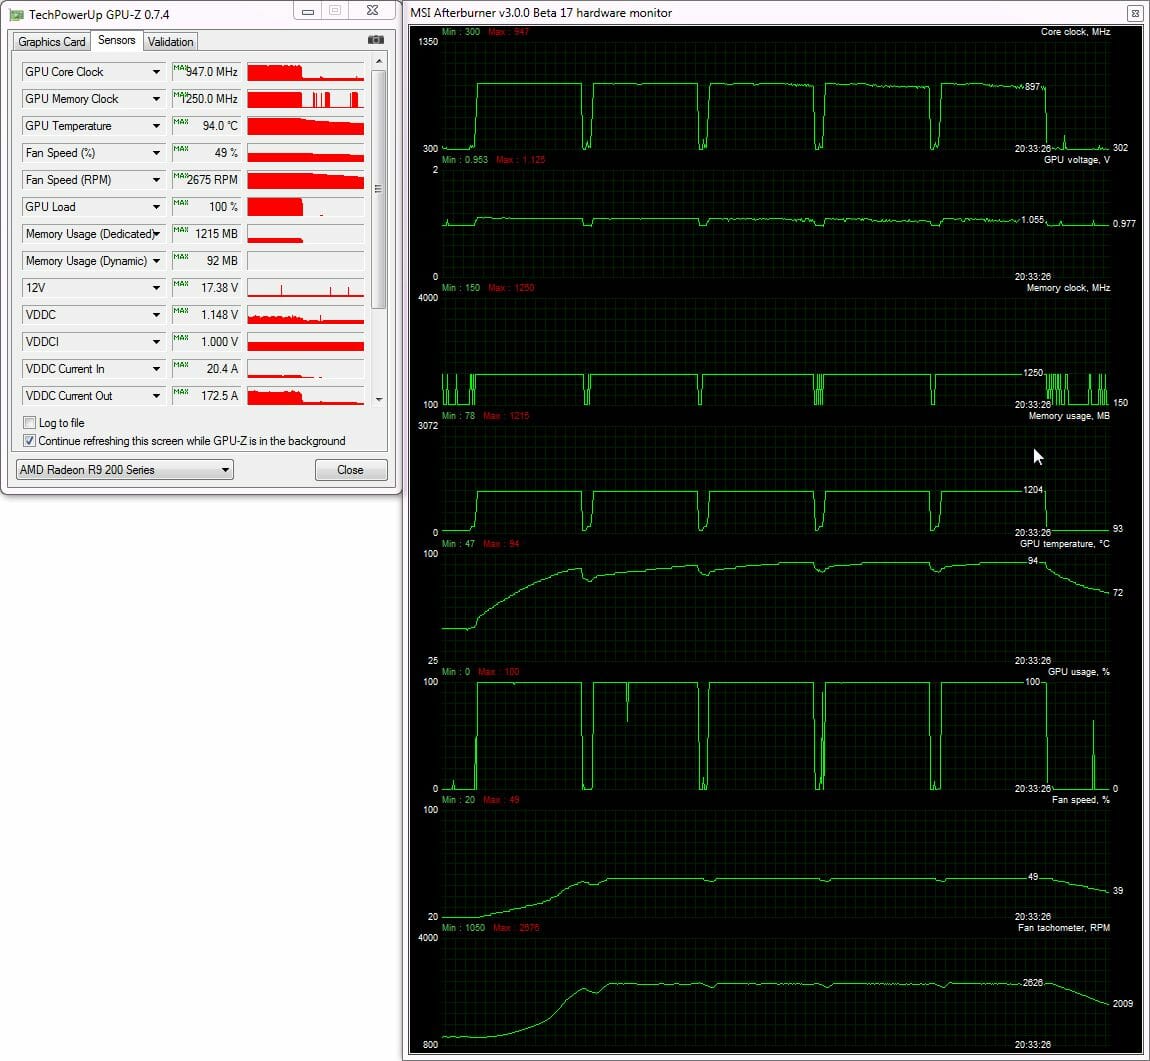
As you can see, the GPU temperature reached 94°C at a fan speed of 2680 RPM (49%) during the third test cycle. Right after that point the GPU clock rate began to drop down. The frequency drops were short and small at first, but got longer and heavier at the end. The fan’s speed and noise level didn’t change, though.
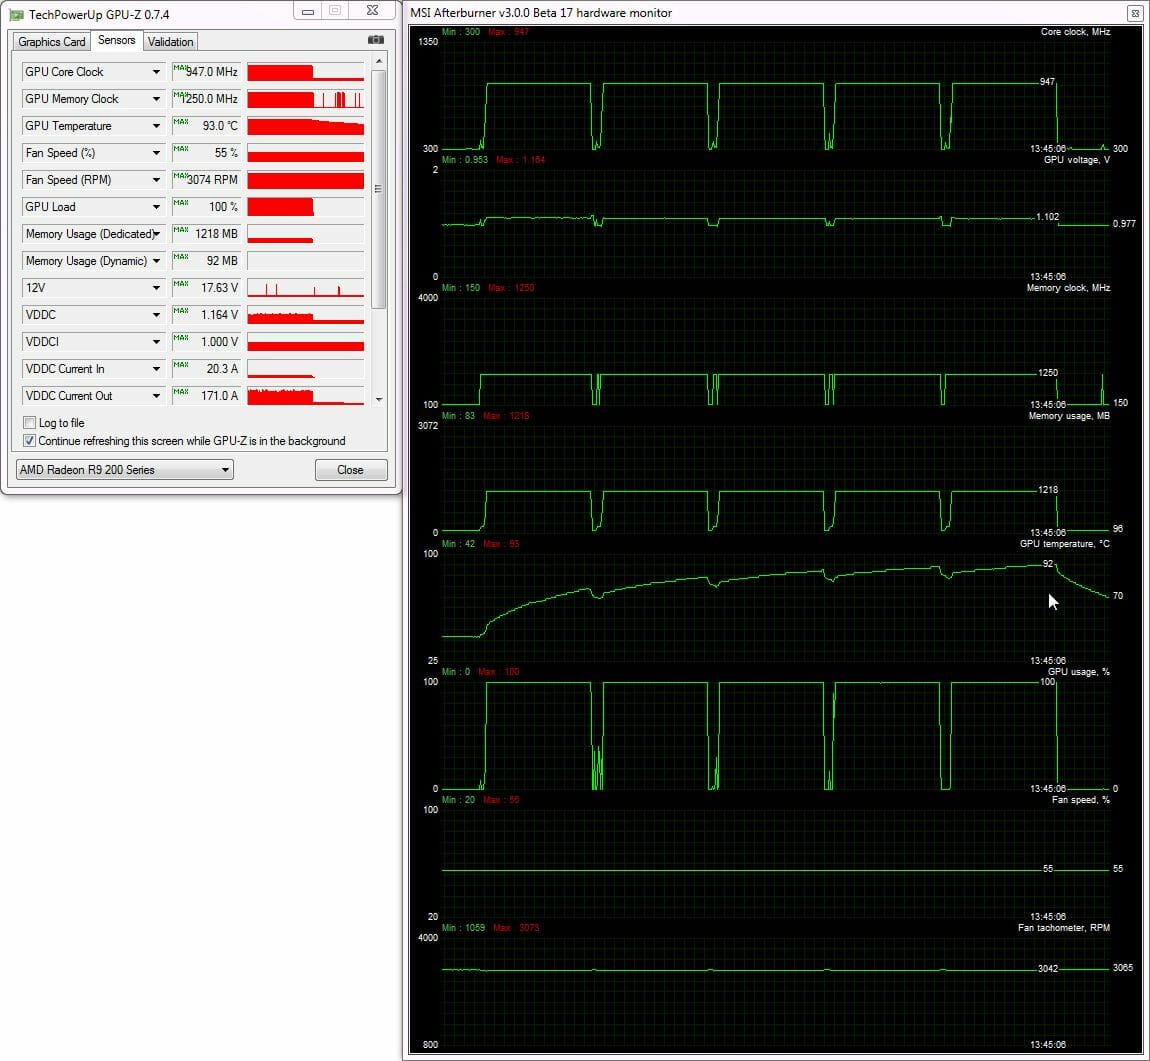
After some experimenting, we found out that the fan had to be set at 3070 RPM (55% of its full speed) to prevent any GPU frequency drops. The GPU temperature was as high as 92°C at that – very close to the critical level.
Replacing the default GPU thermal interface with high-efficiency Arctic MX-4 helped delay the thermal throttling, so the GPU clock rate didn’t drop down at all in our test with the automatically regulated fan:

We guess that the reference Radeon R9 290 is going to overheat in the automatic fan regulation mode anyway at high continuous load. Setting the fan manually at 55% speed helped lower the peak temperature by a couple of degrees more:

Overall, the reference Radeon R9 290 is almost the same as the top-end R9 290X in terms of cooling, which might be expected considering the similar GPUs and identical coolers. And yes, the card is as noisy as the R9 290X.
Overclocking Potential
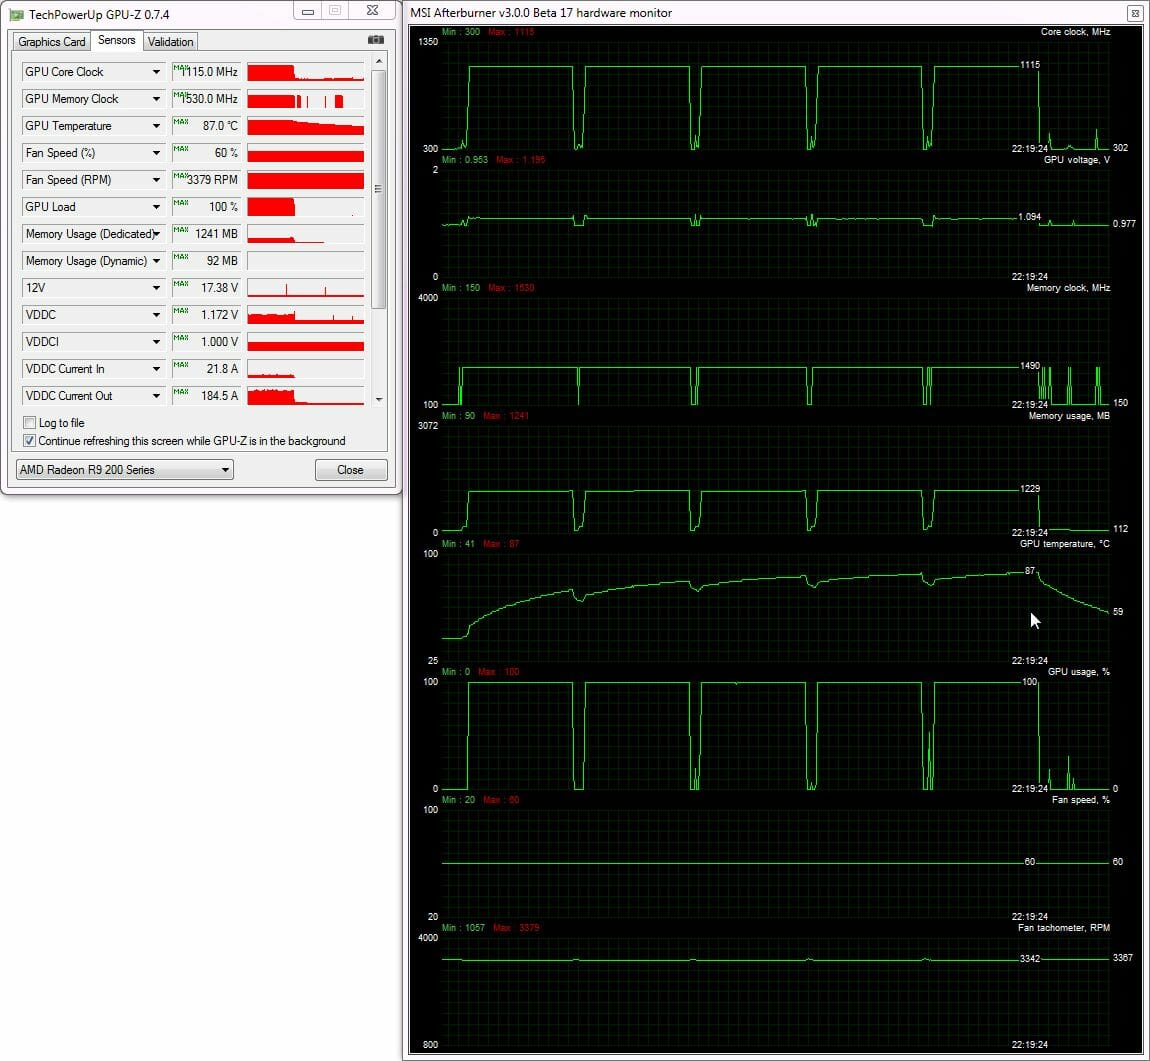
Like the Radeon R9 290X, the Radeon R9 290 has a rather inefficient cooler, so we had to fix its fan speed at 60% or 3380 RPM for our overclocking experiments. We didn’t increase the card’s core voltage. Still, we were quite successful, increasing the GPU and memory frequencies by 168 MHz (+17.7%) and 960 MHz (+19.2%), respectively.
The resulting clock rates were 1115/5960 MHz in 3D mode.
The GPU clock rate is just a little lower compared to the overclocked Radeon R9 290X (1130 MHz) but the memory frequency is 200 MHz higher. We guess that’s a good enough result for a reference card.
At 60% fan speed the overclocked card had a peak GPU temperature of 87°C. The noise was high but the GPU frequency didn’t drop down:
We were overall pleased with the overclocking potential of the Radeon R9 290, especially as the overclocked card delivered high performance.
Testbed and Methods
We used the following components for our testbed:
- Mainboard: Intel Siler DX79SR (Intel X79 Express, LGA 2011, BIOS 0590 dated 17.07.2013)
- CPU: Intel Core i7-3970X Extreme Edition 3.5/4.0 GHz (Sandy Bridge-E, C2, 1.1 V, 6x256KB L2 cache, 15MB L3 cache)
- CPU cooler: Phanteks PH-TC14PE (2xCorsair AF140 fans, 900 RPM)
- Thermal grease: ARCTIC MX-4
- Graphics cards:
- EVGA GeForce GTX 780 Superclocked ACX 3GB (863/916/6008 MHz; and overclocked to 1032/1085/7348 MHz)
- AMD Radeon R9 290X 4GB (1000/5000 MHz)
- AMD Radeon R9 290 4GB (947/5000 MHz; and overclocked to 1115/5960 MHz)
- MSI Radeon R9 280X Gaming 3GB (1050/6000 MHz)
- System memory: DDR3 4x8GB G.SKILL TridentX F3-2133C9Q-32GTX (2133 MHz, 9-11-11-31, 1.6 volts)
- System disk: SSD 256GB Crucial m4 (SATA 6 Gbit/s, CT256M4SSD2, BIOS v0009)
- Games/software disk: Western Digital VelociRaptor (SATA-2, 300 GB, 10000 RPM, 16 MB cache, NCQ) in a Scythe Quiet Drive 3.5″ enclosure
- Backup disk: Samsung Ecogreen F4 HD204UI (SATA-2, 2 TB, 5400 RPM, 32 MB cache, NCQ)
- Computer case: Antec Twelve Hundred (front panel: three Noiseblocker NB-Multiframe S-Series MF12-S2 fans at 1020 RPM; back panel: two Noiseblocker NB-BlackSilentPRO PL-1 fans at 1020 RPM; top panel: one preinstalled 200mm fan at 400 RPM)
- Control & monitoring panel: Zalman ZM-MFC3
- Power supply: Corsair AX1200i (1200 W), 120mm fan
- Monitor: 27″ Samsung S27A850D (DVI-I, 2560×1440, 60 Hz)
We have the same graphics cards as in our previous review excepting the Nvidia GeForce GTX 780 Ti which is far too expensive to be compared with the Radeon R9 290. Besides the latter, the EVGA GeForce GTX 780 Superclocked ACX is tested in overclocked mode. By the way, the EVGA is comparable to the reference Radeon R9 290 in terms of price as of the time of our writing this review.
In order to lower the dependence of the graphics cards’ performance on the overall platform speed, we overclocked our 32nm six-core CPU to 4.8 GHz by setting its frequency multiplier at x48 and enabling Load-Line Calibration. The CPU voltage was increased to 1.38 volts in the mainboard’s BIOS:
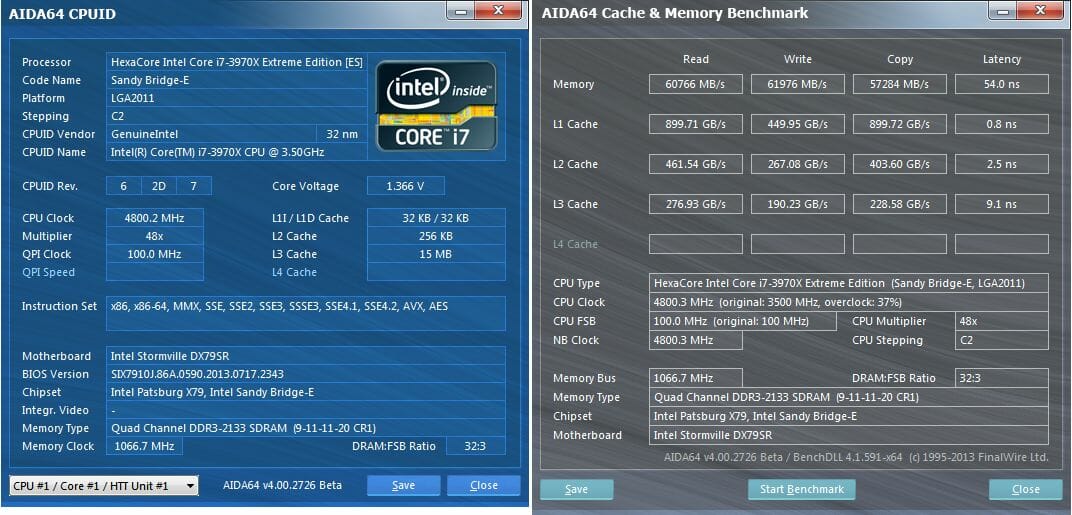
Hyper-Threading was turned on. We used 32 GB of system memory at 2.133 GHz with timings of 9-11-11-20_CR1 and voltage of 1.6125 volts.
The testbed ran Microsoft Windows 7 Ultimate x64 SP1 with all critical updates installed. We used the following drivers:
- Intel Chipset Drivers – 9.4.4.1006 WHQL dated 21.09.2013
- DirectX End-User Runtimes, dated 30 November 2010
- AMD Catalyst 13.12 WHQL (13.251.0.0) dated 18.12.2013
- GeForce 331.93 Beta dated 27.11.2013
We benchmarked the graphics cards’ performance at two display resolutions: 1920×1080 and 2560×1440 pixels. There were two visual quality modes: “Quality+AF16x” means the default texturing quality in the drivers + 16x anisotropic filtering whereas “Quality+ AF16x+MSAA 4x(8x)” means 16x anisotropic filtering and 4x or 8x antialiasing. We enabled anisotropic filtering and full-screen antialiasing from the game’s menu. If the corresponding options were missing, we changed these settings in the Control Panels of the Catalyst and GeForce drivers. We also disabled Vsync there. There were no other changes in the driver settings.
The graphics cards were tested in two benchmarks and 15 games updated to the latest versions.
- 3DMark (2013) (DirectX 9/11) version 1.2.250.0: Cloud Gate, Fire Strike and Fire Strike Extreme scenes.
- Unigine Valley Bench (DirectX 11) version 1.0: maximum visual quality settings, 16x AF and/or 4x MSAA, 1920×1080.
- Total War: SHOGUN 2 – Fall of the Samurai (DirectX 11) version 1.1.0: integrated benchmark (the Sekigahara battle) with maximum visual quality settings and 8x MSAA.
- Battlefield 3 (DirectX 11) version 1.4: Ultra settings, two successive runs of a scripted scene from the beginning of the “Going Hunting” mission (110 seconds long).
- Sniper Elite V2 Benchmark (DirectX 11) version 1.05: Adrenaline Sniper Elite V2 Benchmark Tool v1.0.0.2 BETA with maximum graphics quality settings (“Ultra” profile), Advanced Shadows: HIGH, Ambient Occlusion: ON, Stereo 3D: OFF, Supersampling: OFF, two sequential runs of the test.
- Sleeping Dogs (DirectX 11) version 1.5: Adrenaline Sleeping Dogs Benchmark Tool v1.0.2.1 with maximum image quality settings, Hi-Res Textures pack installed, FPS Limiter and V-Sync disabled, two consecutive runs of the built-in benchmark with quality antialiasing at Normal and Extreme levels.
- Hitman: Absolution (DirectX 11) version 1.0.447.0: built-in test with Ultra settings, enabled tessellation, FXAA and global lighting.
- Crysis 3 (DirectX 11) version 1.2.0.1000: maximum visual quality settings, Motion Blur – Medium, lens flares – on, FXAA and MSAA 4x, two consecutive runs of a scripted scene from the beginning of the “Swamp” mission (110 seconds long).
- Tomb Raider (2013) (DirectX 11) version 1.1.748.0: Adrenaline Benchmark Tool, “Ultra” image quality settings, V-Sync disabled, FXAA and 2x SSAA antialiasing enabled, TessFX technology activated, two consecutive runs of the in-game benchmark.
- BioShock Infinite (DirectX 11) version 1.1.24.21018: Adrenaline Action Benchmark Tool with “Ultra” and “Ultra+DOF” quality settings, two consecutive runs of the in-game benchmark.
- Metro: Last Light (DirectX 11) version 1.0.0.15: we used the built-in benchmark for two consecutive runs of the D6 scene. All image quality and tessellation settings were at “Very High”, Advanced PhysX technology enabled, with and without SSAA antialiasing.
- GRID 2 (DirectX 11) version 1.0.85.8679: we used the built-in benchmark, the visual quality settings were all at their maximums, the tests ran with and without MSAA 8x antialiasing with eight cars on the Chicago track.
- Company of Heroes 2 (DirectX 11) version 3.0.0.11811: two consecutive runs of the integrated benchmark at maximum image quality and physics effects settings.
- Total War: Rome II (DirectX 11) version 1.8.0 build 8891.481024: Extreme quality, V-Sync disabled, SSAA enabled, two consecutive runs of the integrated benchmark.
- ArmA III (DirectX 11) version 1.08.0.113494: ArmA3Mark with Ultra quality, V-Sync disabled, two consecutive runs of the integrated benchmark.
- Batman: Arkham Origins (DirectX 11) version 1.0 update 8: Ultra visual quality, V-Sync disabled, all the effects enabled, all DX11 Enhanced features enabled, Hardware Accelerated PhysX = Normal, two consecutive runs of the in-game benchmark.
- Battlefield 4 (DirectX 11) version 1.4: Ultra settings, two successive runs of a scripted scene from the beginning of the “Tashgar” mission (110 seconds long).
We publish the bottom frame rate for games that report it. Each test was run twice, the final result being the best of the two if they differed by less than 1%. If we had a larger difference, we reran the test at least once again to get repeatable results.
Performance
The results of the AMD Radeon R9 290 and R9 290X are marked in red in the diagrams below. The color of the EVGA GeForce GTX 80 Superclocked ACX is green. The MSI Radeon R9 280X Gaming is lilac.
3DMark (2013)
The second test scene of 3DMark, Cloud Gate, cannot squeeze everything out of these top-end graphics cards, but Fire Strike is perfect for benchmarking such solutions. The AMD Radeon R9 290 is expectedly slower than its senior X-marked cousin but easily beats its direct opponent GeForce GTX 780. When overclocked, it beats the Radeon R9 290X as well as the original EVGA GeForce GTX 780 which is itself overclocked by 19.6-22.3%. That’s a good start for AMD’s card!
Unigine Valley Bench
Nvidia looks better in this benchmark, yet the overclocked Radeon R9 290 beats the more expensive Radeon R9 290X as well as the EVGA version of GeForce GTX 780. The latter only wins this competition when overclocked.
The games are listed below in the order of their market release.
Total War: SHOGUN 2 – Fall of the Samurai
The Radeon R9 290 and the GeForce GTX 780 end their struggle in a tie – both at the default clock rates and in the overclocked mode. The difference between them is never larger than 1-3 fps. The R9 290 is 5 to 9% behind the R9 290X and can easily bridge the gap through overclocking.
Battlefield 3
We’ve got the same standings here as in the previous test:
Sniper Elite V2 Benchmark
As opposed to the two previous games, Sniper Elite V2 favors Nvidia:
The Radeon R9 290 falls behind the GeForce GTX 780 by 15 to 17% in every test mode. The overclocked Radeon R9 290 can reach the same speed as the standard GTX 780 and also beats the Radeon R9 290X.
Sleeping Dogs
AMD is overall superior in this game. Its Radeon R9 290 is up to 15% faster than the GeForce GTX 780. The R9 290 is also slower than its X cousin by 3-9% but goes ahead by 2-9% when overclocked.
Hitman: Absolution
Hitman: Absolution favors AMD-based products as is indicated by the test results.
Crysis 3
It’s hard to choose between the Radeon R9 290 and GeForce GTX 780 for playing Crysis 3 since they deliver very close results. The R9 290 is a mere 4-7% slower than its X-marked cousin and beats the latter when overclocked.
Tomb Raider (2013)
Contrary to our expectations, AMD isn’t unrivalled in this test.
As you can see, the Radeon R9 290 and GeForce GTX 780 are very close to each other. The difference between the R9 290 and the R9 290X is the same as in the previous tests.
BioShock Infinite
BioShock Infinite is yet another game where there’s but a negligible difference between the Radeon R9 290 and the GeForce GTX 780 in terms of average frame rate. The AMD-based products have an advantage in bottom speed, though. This must be due to the specifics of the particular test scene.
Metro: Last Light
As usual, we’ll first run this game with the Advanced PhysX option turned on.
Nvidia’s GeForce series is superior in this test in terms of both average and bottom speed. But the picture changes when we disable Advanced PhysX:
Now the Radeon R9 290 is as good as the GeForce GTX 780 and even beats the latter when antialiasing is turned off. The gap between the R9 290 and the flagship R9 290X is the same as in most of the previous tests.
GRID 2
GRID 2 doesn’t tell us which card is faster: the GeForce GTX 780 or the Radeon R9 290. The latter is just a little ahead of the GTX 780 (and of the Radeon R9 290X, too) in the overclocked mode.
Company of Heroes 2
Nvidia-based cards can’t match AMD-based solutions in this game.
The Radeon R9 290 enjoys its maximum advantage over the GeForce GTX 780 in this test session – up to 27%! Falling behind the R9 290X by 3-10% at its default frequencies, the R9 290 goes ahead in the overclocked mode. Thus, it can make a good buy for overclockers.
Total War: Rome II
The Radeon R9 290 equals the GeForce GTX 780 in this test.
ArmA III
This test can only be used for top-end graphics cards at 2560×1440.
And the Radeon R9 290 equals the GeForce GTX 780 once again.
Batman: Arkham Origins
It is more comfortable to play this game on the GeForce GTX series when we don’t use MSAA but the AMD-based products go ahead with 8x MSAA. For example, the Radeon R9 290 is 19% faster than the GeForce GTX 780 at 2560×1440 with maximum visual quality settings.
Battlefield 4
The Radeon R9 290 is a little faster than the GeForce GTX 780 both at the default frequencies and in the overclocked mode. It is 5-7% slower in comparison with the R9 290X but beats the latter by 8% when overclocked.
The results of this test session are summed up in the following table:
Now we can proceed to our performance summary charts.
Performance Summary
As you may have learned from our previous review, the Radeon R9 290X is about 30% faster than the R9 280X. Now let’s see how faster the R9 290 (without the “X”) is in comparison with the same R9 280X:
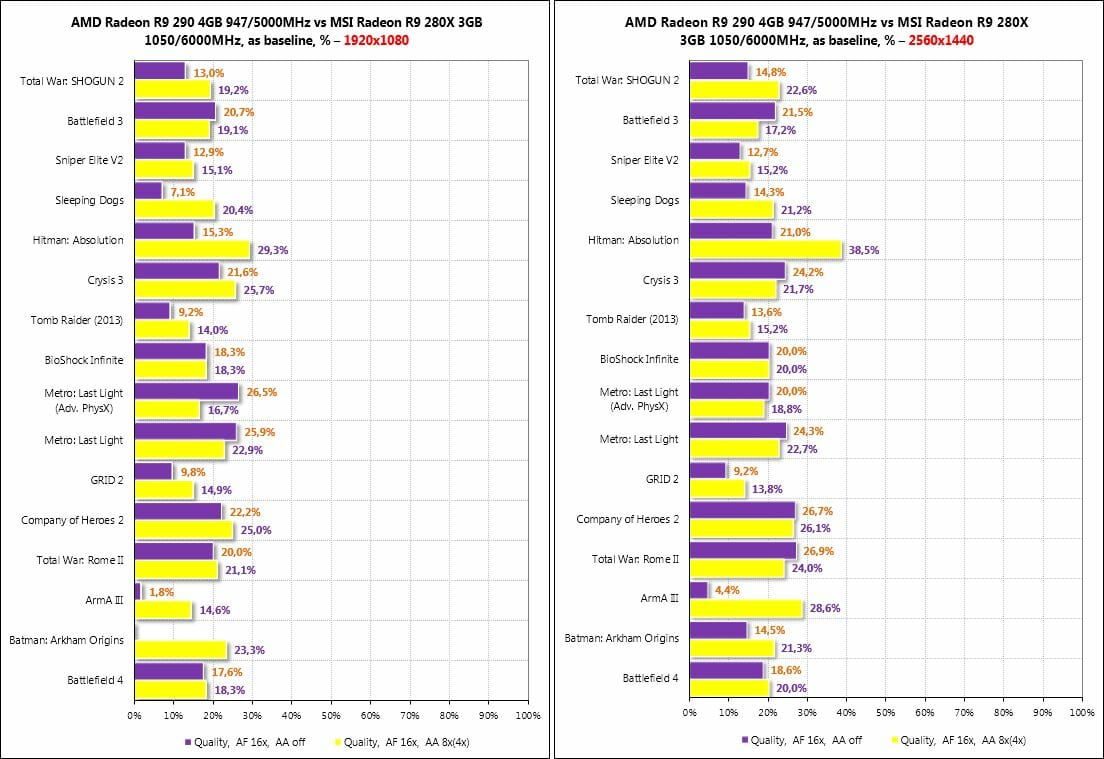
So, the standard Radeon R9 290 is 15.1-19.9% faster than the MSI Radeon R9 280X (1050/6000 MHz) at 1920×1080 and 17.9-21.7% faster at 2560×1440. That’s exactly what we might expect considering that the difference in their recommended prices is less than $100 (or 25% of the Radeon R9 290’s price). However, the current prices are very far from what the GPU developers planned.
Now let’s check out the difference between the Radeon R9 290 and the top-end R9 290X:
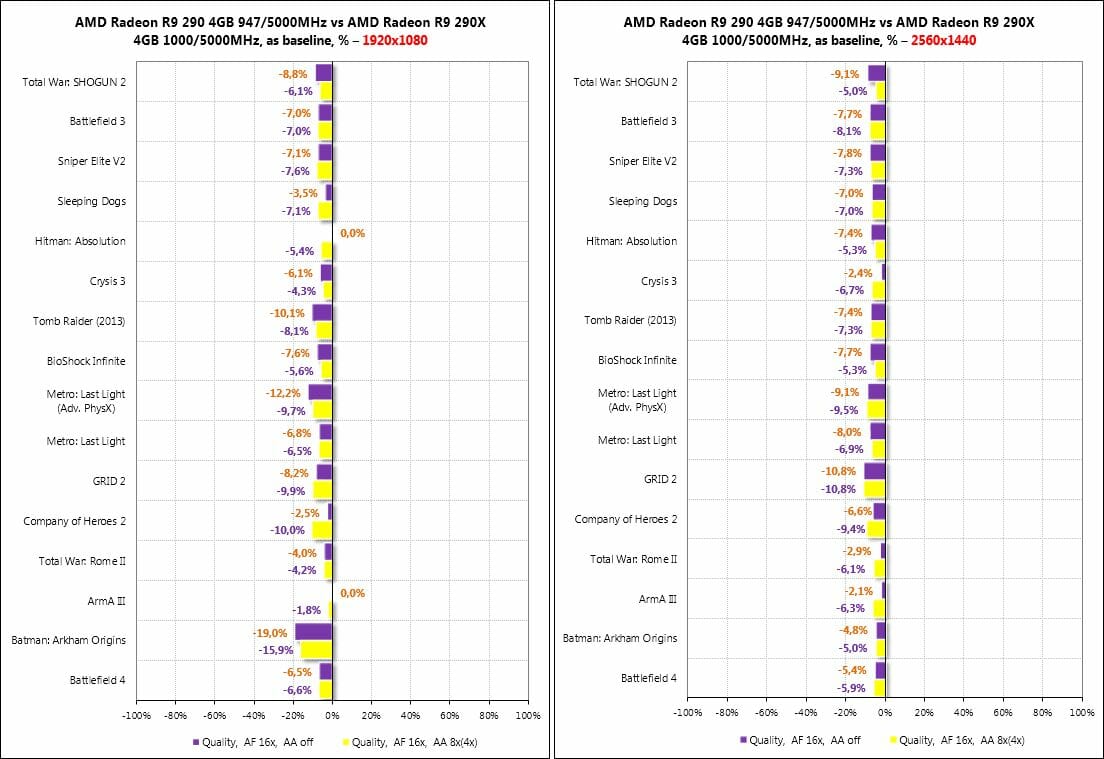
The junior Hawaii XT based card is surprisingly fast. It is a mere 7% behind both at 1920×1080 and 2560×1440. The biggest gap can be observed at one resolution in Batman: Arkham Origins, but it must be due to the specifics of the in-game benchmark rather than to the real difference in performance between the Radeon R9 290X and the Radeon R9 290.
Now let’s see how fast the Radeon R9 290 becomes when overclocked. We managed to increase its GPU and memory frequencies by 17.7% and 19.2%, respectively. And the performance scalability is quite high:
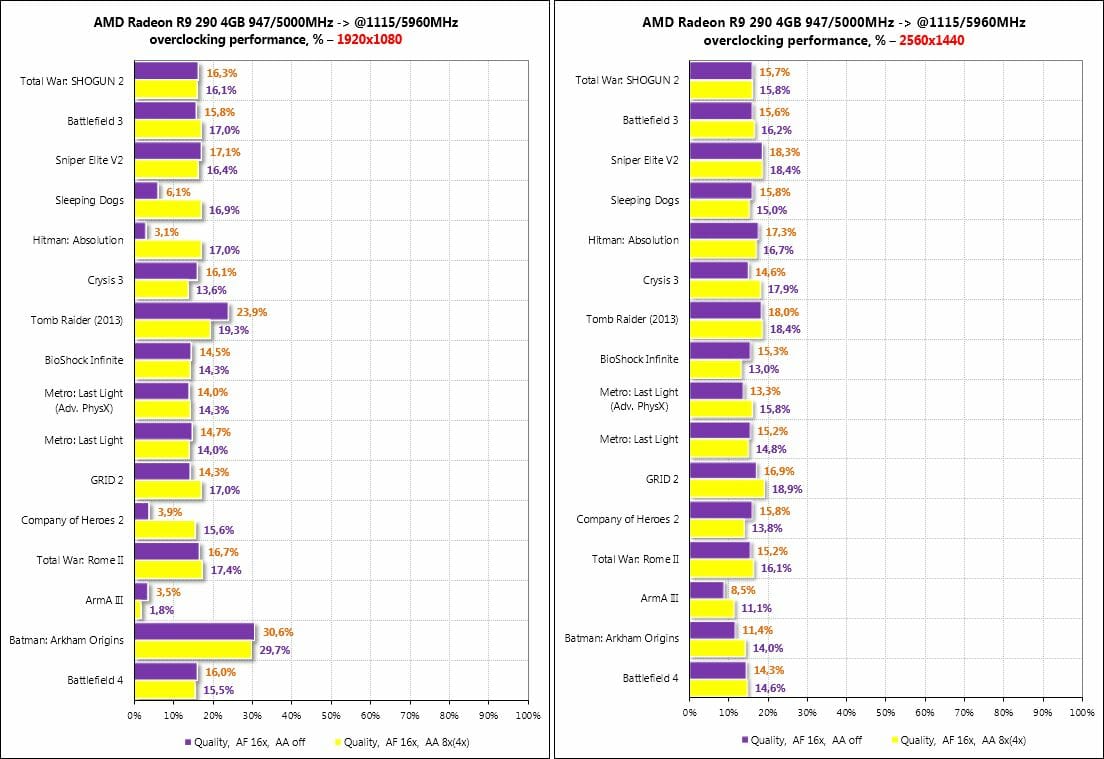
The overclocked card gets 14-16% faster at 1920×1080 and 15-16% faster at 2560×1440. Of course, the overclocked R9 290 easily beats the standard Radeon R9 290X:
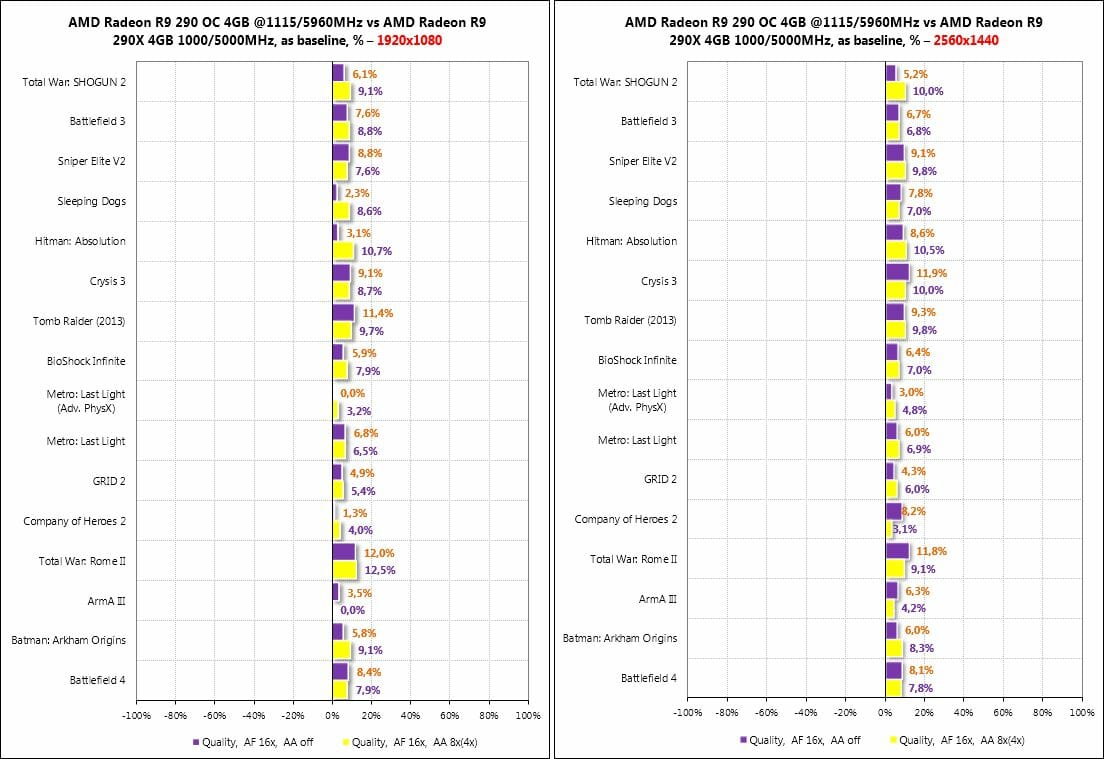
Working at 1115/5960 MHz, the Radeon R9 290 is 6-8% ahead of the standard R9 290X at 1920×1080 and 7-8% ahead at 2560×1440. Our overclocking proves to be enough to make up for the deficiencies of the cut-down Hawaii XT core.
Now, we’ve got two more interesting comparisons. First goes the Radeon R9 290 vs. the GeForce GTX 780 at their default frequencies:
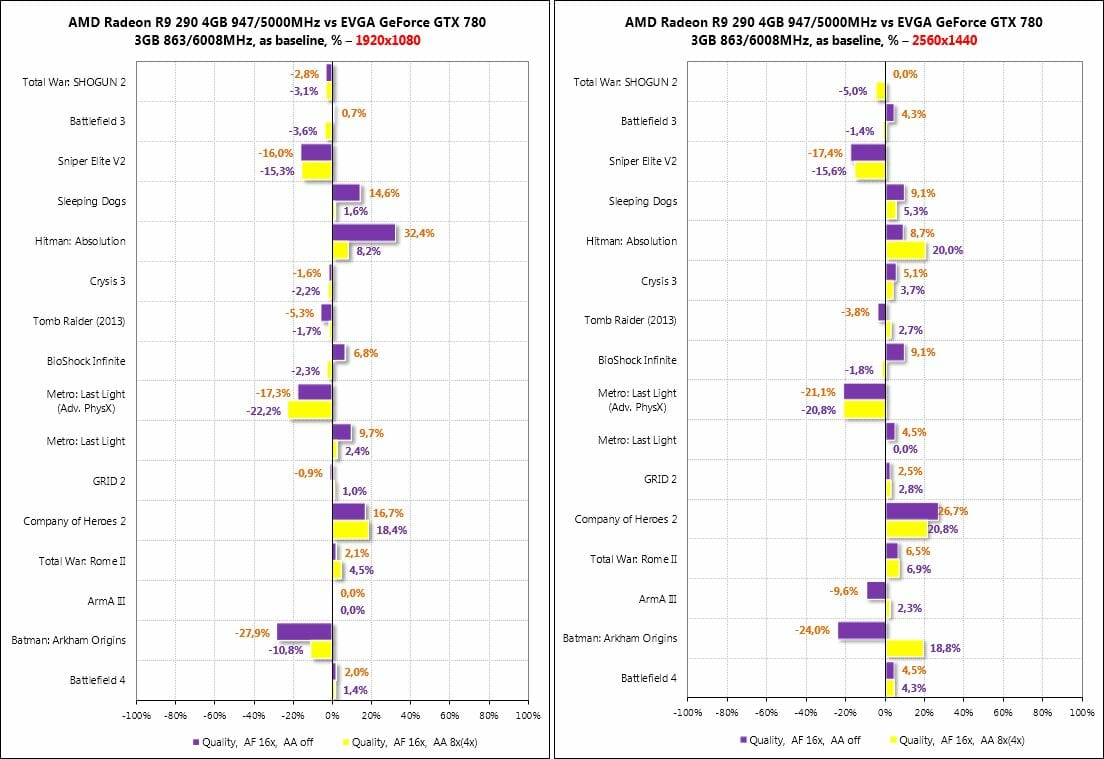
The Radeon R9 290 wins in Sleeping Dogs, Hitman: Absolution, Company of Heroes 2 and Total War: Rome II whereas the GeForce GTX 780 is ahead in Sniper Elite V2, Metro: Last Light (with Advanced PhysX turned on) and in Batman: Arkham Origins (in three out of the four test modes). In the rest of the games the two cards deliver the same performance. So, the Radeon R9 290 is equal to the GeForce GTX 780 on average across all of our tests.
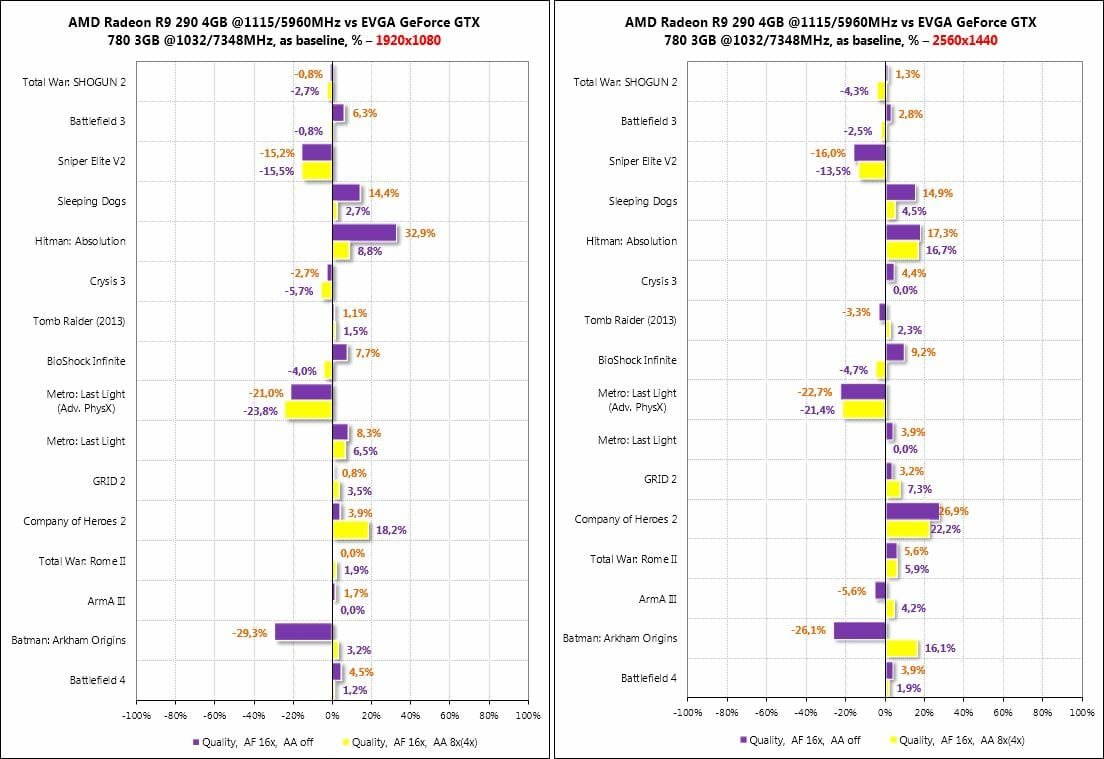
Thanks to the higher overclocking potential of the original card from EVGA, the overclocked GeForce GTX 780 performs better in comparison with the overclocked Radeon R9 290. The overall picture remains the same, though:
Power Consumption
We measured the power consumption of computer systems with different graphics cards using a multifunctional panel Zalman ZM-MFC3 which can report how much power a computer (the monitor not included) draws from a wall socket. There were two test modes: 2D (editing documents in Microsoft Word and web surfing) and 3D (the intro scene of the Swamp level from Crysis 3 running four times in a loop at 2560×1440 with maximum visual quality settings but without MSAA). Here are the results:
The AMD Radeon R9 290 configuration needs a mere 16 watts less than the Radeon R9 290X. When the junior Hawaii XT-based product is overclocked, the power consumption grows by 33 watts, reaching 569 watts at peak load.
The GeForce GTX 780 configuration is somewhat more economical, both in the default and overclocked mode. A 600-watt PSU is going to be enough for any of the tested configurations, though.
The different configurations consume about the same amount of power in 2D applications.
Conclusion
According to our today’s tests and judging by the recommended prices, the AMD Radeon R9 290 seems to be a more attractive buy than the top-end Radeon R9 290X. Being a mere 7% slower, the R9 290 is supposed to be 27% cheaper than its cousin. Moreover, it can be easily overclocked to the same or higher level as the R9 290X even with its inefficient reference cooler. The Radeon R9 290 also gives you a chance to unlock the disabled GPU subunits and get a full-featured R9 290X at a far more attractive price.
Comparing the Radeon R9 290 against the GeForce GTX 780, we can say that they are equal in terms of performance. They also cost the same money today although the Radeon R9 290 is supposed to sell for $100 less. Released earlier, the GeForce GTX 780 is currently available in a lot of original versions which feature high-efficiency coolers, factory overclocking (+100 MHz and more for the GPU) and high overclocking potential of the memory chips. Of course, original Radeon R9 290 cards will come out as well, but they seem to have less aggressive factory overclocking. In this case, original GeForce GTX 780s are going to be faster than original Radeon R9 290s.
Anyway, we still want to thank AMD for making Nvidia cut its prices and launch the fast GeForce GTX 780 Ti model as a response to the Radeon R9 290 and R9 290X. Tough competition is always good for end users.
So now we’re eagerly waiting for original versions of AMD’s new Radeons to check out if the manufacturers can eliminate their downsides in the way of high temperature and noise.