Understanding Bottlenecks – GPU Busy & Intel PresentMon
Bottlenecks are used as a scarecrow for new PC builders that can often lead them down the path of investing a lot more money into their build than previously anticipated. In truth, you will always be bottlenecked by something since PC hardware does not just simply scale linearly into infinity – there is always a stopping point no matter how good your parts are.
To understand the concept of bottlenecks better Intel has introduced a new monitoring software metric called GPU Busy into their PresentMon tool. This new metric along with the new Intel PresentMon utility offers you a quick way to check how well-balanced your hardware is, and whether it is being used to its full potential.
What Is GPU Busy?
GPU Busy is a new metric that measures how much time in milliseconds the GPU spends rendering each frame while you are gaming.
The reason this metric is useful is because overlaid with a Frame Time graph that measures your CPU activity you can effectively see which component is working harder (represented in higher ms) therefore which major component is holding you back.
Intel PresentMon
To be able to see these graphs you would have to use a utility that uses the PresentMon capture service v1.9.0 like the Intel PresentMon tool (with which the GPU Busy metric was introduced) or CapFrameX which is adopting the metric in its new releases.
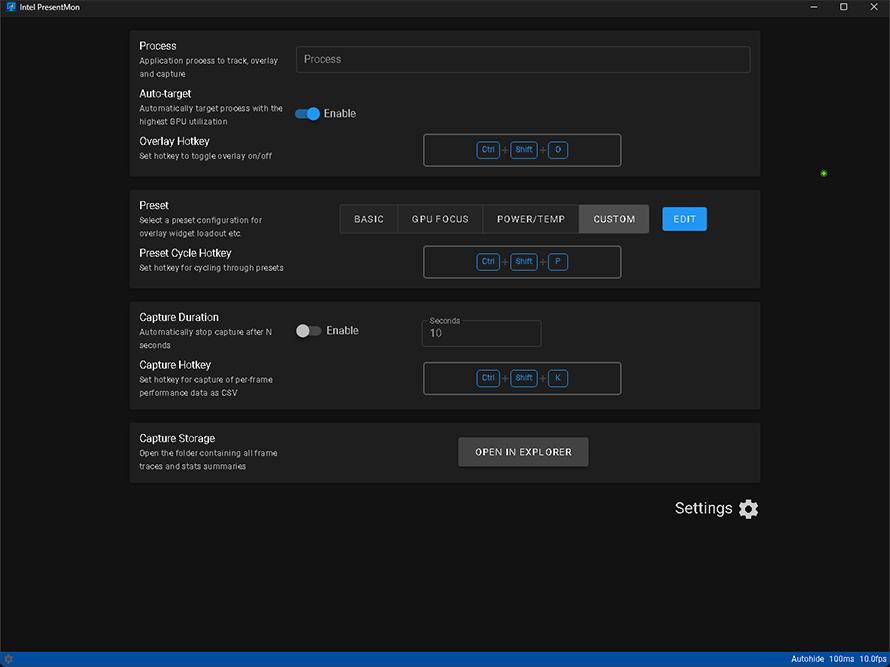
For the sake of respecting Intel’s work, I decided to use their PresentMon software which is quite simple to use. You open the tool, make sure the game process is being captured, and choose one of the presets for the graphs (or create a custom one like me).
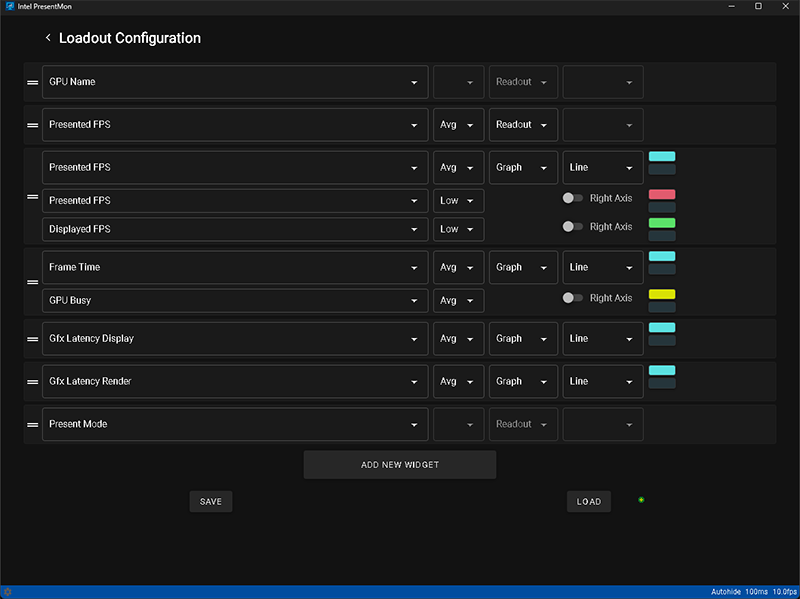
These are the metrics that interest me the most but you might have a different looking graph for your games and testing.
Testing My System in Games
Currently, I am using a 5800X3D paired with an NVIDIA 3080 and 3800MHz CL 16 RAM with tuned values. I built this system minding the balance of the parts but testing it out in games using GPU Busy would confirm to me that I did a good job.
The graphs will also confirm whether I have managed to set up the system software correctly since even with good hardware, if you got the software side wrong your PC might not perform as expected.
My testing was quite simple and consisted of me going into 3 games to see if my CPU and GPU were close in balance and performance. The games I tested were Counter-Strike 2, Overwatch 2, and KovaaK’s.
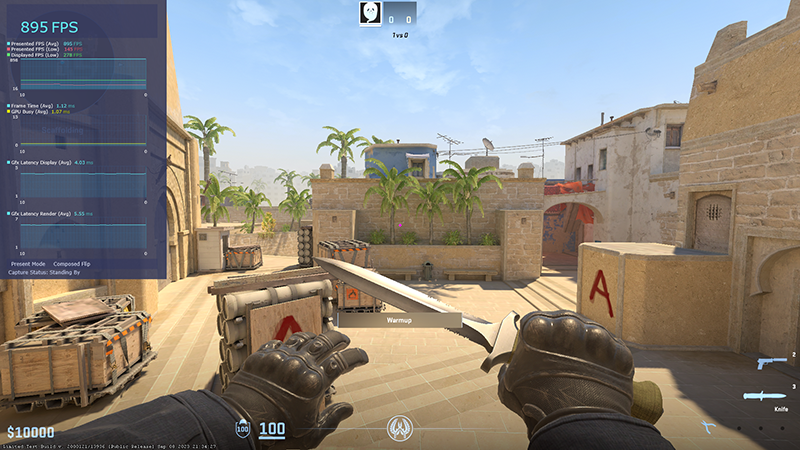
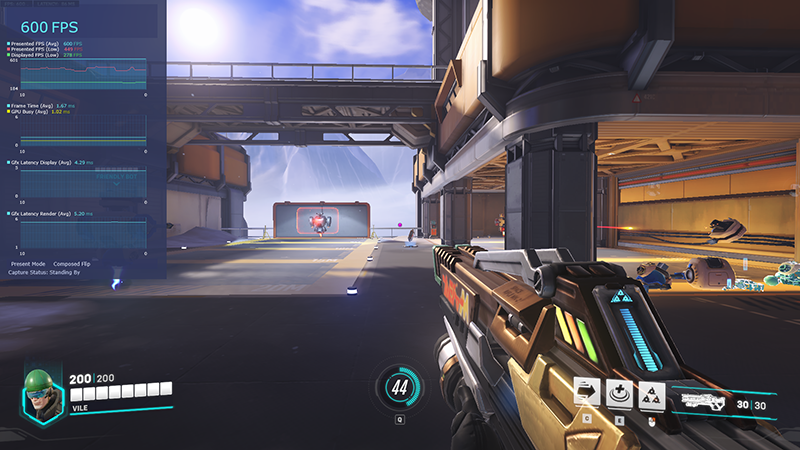
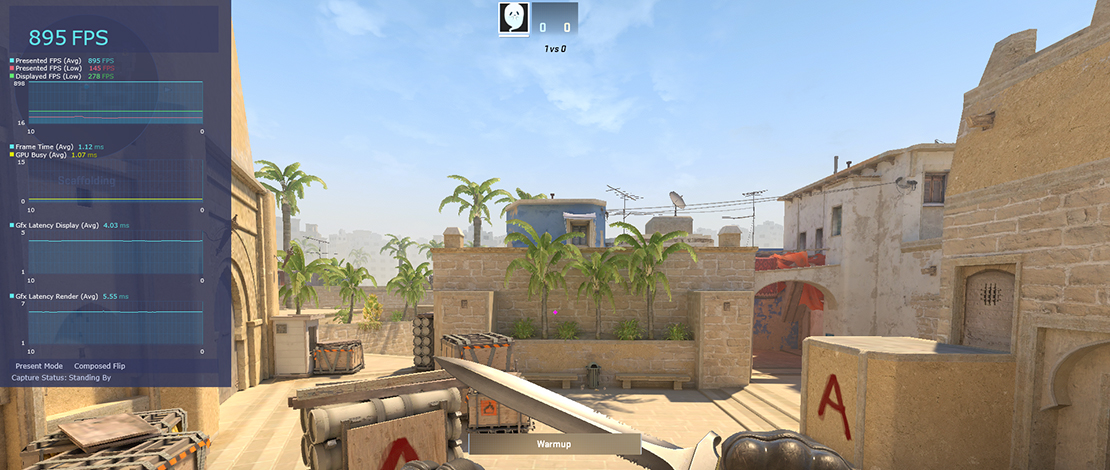
I uncapped my FPS (OW2 runs at an engine cap of 600 FPS max) to let both my GPU and CPU stretch their legs and looked at the Frame Time and GPU Busy graphs which are presented nicely in one tab.
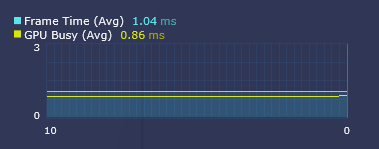
The closer the millisecond values and respectively the lines denoting Frame Time and GPU Busy, the closer the performance of the two parts.
The values were quite constant at:
- Counter-Strike 2 -1.12 ms Frame Time and 1.07 ms GPU Busy
- Overwatch 2 – 1.67 ms Frame Time and 1.02 ms GPU Busy
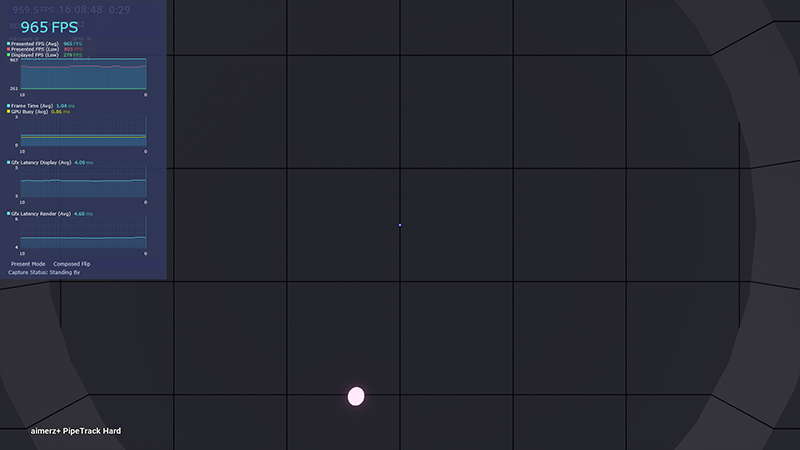
- KovaaK’s – 1.04 ms Frame Time and 0.86 ms GPU Busy
Understanding the Graphs
The graphs and values shown above are a simple benchmark test showcasing ideal circumstances where I am standing still and just looking at the Frame Time and GPU Busy values. While playing you might notice your graphs and values continuously move up and down since depending on what you are rendering on your screen you might be putting a higher load on one of your components.
Ideally, the difference in values should still be small meaning that your CPU and GPU are balanced while a big gap between the graph lines and values would indicate a certain bottleneck. Sometimes, however, it might not be your machine that is working poorly but the game engine being unoptimized and unable to make full use of your parts.
TL;DR
Enable GPU Busy and Frame Time graphs in Intel PresentMon and watch their values in ms and graphs. If the graphs and values are close to each other (the two graphs are overlaid) then your components are balanced.
If the graphs and ms values show that one of the components has higher render times in ms and the graphs are apart by a considerable distance then that component is the bottleneck for your system (at least for the game you are testing).