Micro-Adjusting the Timer Resolution – Automating the Process
I have already talked about Amit’s discovery of increased precision while micro-adjusting your timer resolution in a previous article. The process of finding the value at which you have the best precision is a pretty tedious manual task in which you would have to run a benchmark and change the values of the timer resolution while recording the samples to see which value provides the best precision.
Luckily Amit automated the process by using a PowerShell script which makes the entire process a lot smoother for people newer to PC optimization.
Gathering the Files
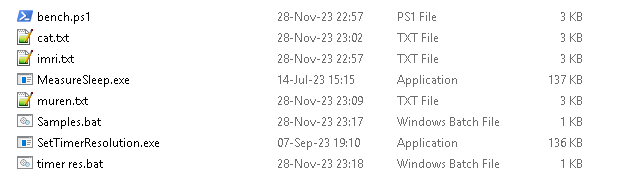
To get started you need to head over to Amit’s GitHub and download the necessary files. Download the MeasureSleep.exe, SetTimerResolution.exe, and the script itself from GitHub and place them all in one folder.
I would give the script a try first to see if it runs because some people might need to set their ExecutionPolicy to Unrestricted (Set-ExecutionPolicy Unrestricted) in PowerShell.
Running the Script
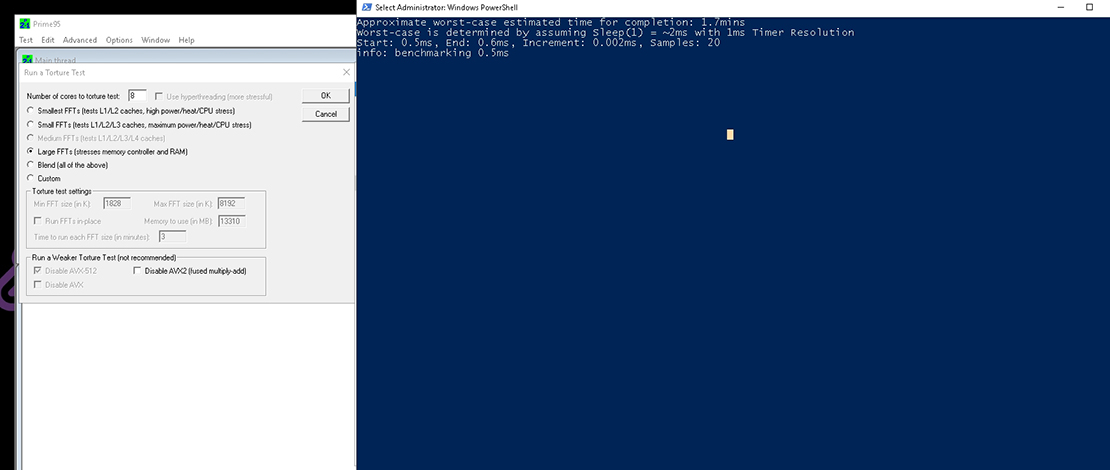
With all the files in place, you just need to close any application that might request a resolution higher than 1 millisecond and choose a stress test to run while the script is testing the values. The most popular choices in terms of benchmarks for this test were Prime95 Large FFTs and y-cruncher VST.
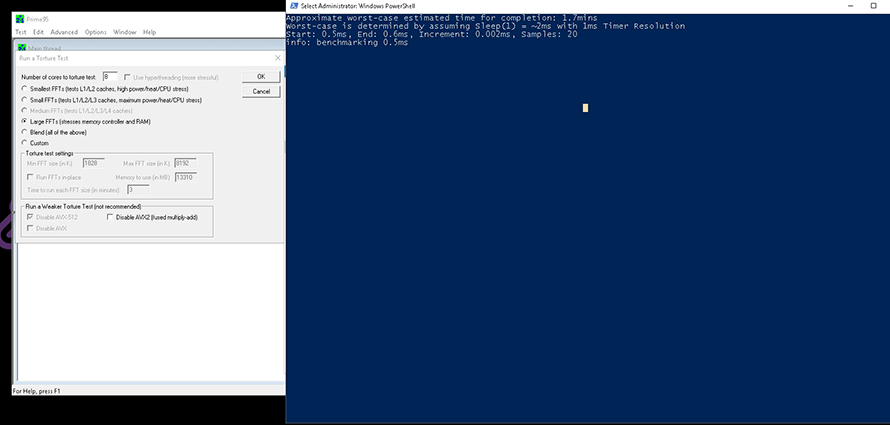
Run your stress test, run the script, and wait for it to complete testing the values.
Plotting the Results
Once the script is done running it will generate a .txt file with the results. You can head over to this site and plot it to see what timer resolution value will give you the highest precision.
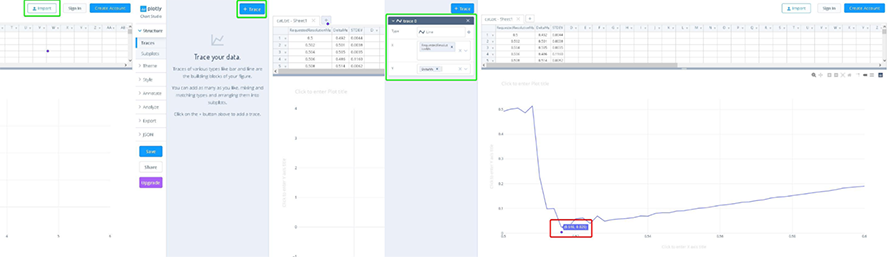
Press Import -> select your file -> create a trace -> select the line option -> plot your RequestedResolutionMs and the DeltaMs. The value with the lowest delta in ms on the graph is the value you would want to use for your timer resolution.
This process is much simpler since you do not have to manually stop the timer resolution, change the value, let it run again, and run the samples to test stability during stress testing.
TL;DR
Instead of manually adjusting your timer resolution value for the highest precision you can use Amit’s new script and let it do it for you without the usual hassle.
1) What do you think can be the issue if the produced graph in chart-studio is all over the place (looks like a kid has drawn a chain of mountain tops in 2D) and not a steady curved line like yours? 2) In what state should the benchmark/script be run? (or do you have to run the script for every combination of clock and tick you can possibly set up?) 3) I find that no matter what combination of clock and tick (synced using legacy or enhanced or desynced) gives 0,5 ms spikes at random intervals during gameplay and using… Read more »
1.Usually CPU power savings or anything that affects the CPU responsiveness would impact the way the chart looks like. 2.I run the script while under heavy bench loads like Prime95 to find the stable point without spikes while under load. 3.Some spikes will happen no matter what but in general if you find a value that is stable under heavy load that offers the highest precision that is what I would run. It would be hard to give specific advice without knowing how your system is set up and testing things myself but in general no power savings = best… Read more »